Step 8 — Frontend Development
1. Scope and architecture
The frontend is a real-time dashboard that presents the cluster's health, sensor detections, and infrastructure state.
| Layer Component | Technology | Function |
|---|---|---|
| UI Framework | React 18 + TypeScript, Vite | Component rendering, dev server, build tooling |
| State | Zustand + Immer | Per-domain stores (cluster, monitoring, detection, notification) |
| Styling | Tailwind CSS | Utility-first styling, custom neon/glass design system |
| Charts | Recharts | GFLOPS, MPI scaling, Amdahl/Gustafson, storage/detection breakdowns |
| 3D visualization | React Three Fiber + Drei | Cluster topology scene on the Dashboard |
| Motion | Framer Motion | Page transitions, list animations |
| Routing | React Router v6 | Client-side page navigation |
| API transport | REST via fetch |
/api/* → FastAPI backend on the Pi 5 master |
| Production serving | Docker, multi-stage build, Nginx | Static build served by Nginx; /api/* and /images/* reverse-proxied to the FastAPI container |
The frontend is built as a static bundle and served by Nginx inside a Docker container (edge-frontend) on the Pi 5 master, alongside the backend's Compose stack. Nginx reverse-proxies /api and /images to the FastAPI service on the same host. The live camera relay (/api/stream) follows the same path.
Deployment note: the task spec calls for the frontend to run as a Docker container on a k3s cluster. In practice the backend stack (Task 7) runs as a single-host Docker Compose deployment on the Pi 5 master rather than a Pi 3 k3s cluster, so the frontend is deployed the same way — as an edge-frontend Docker container in the same docker-compose.yml, not on k3s. The container is built from a multi-stage Dockerfile (Node 22 build stage → nginx:alpine runtime stage) and set to restart: unless-stopped so it survives a host reboot.
Each page polls its own REST endpoint on a short interval (typically 5s) and writes into its own Zustand store, keeping the pages independent of one another.
2. Pages
The dashboard has eight pages, all reachable from the sidebar.
2.1 Dashboard
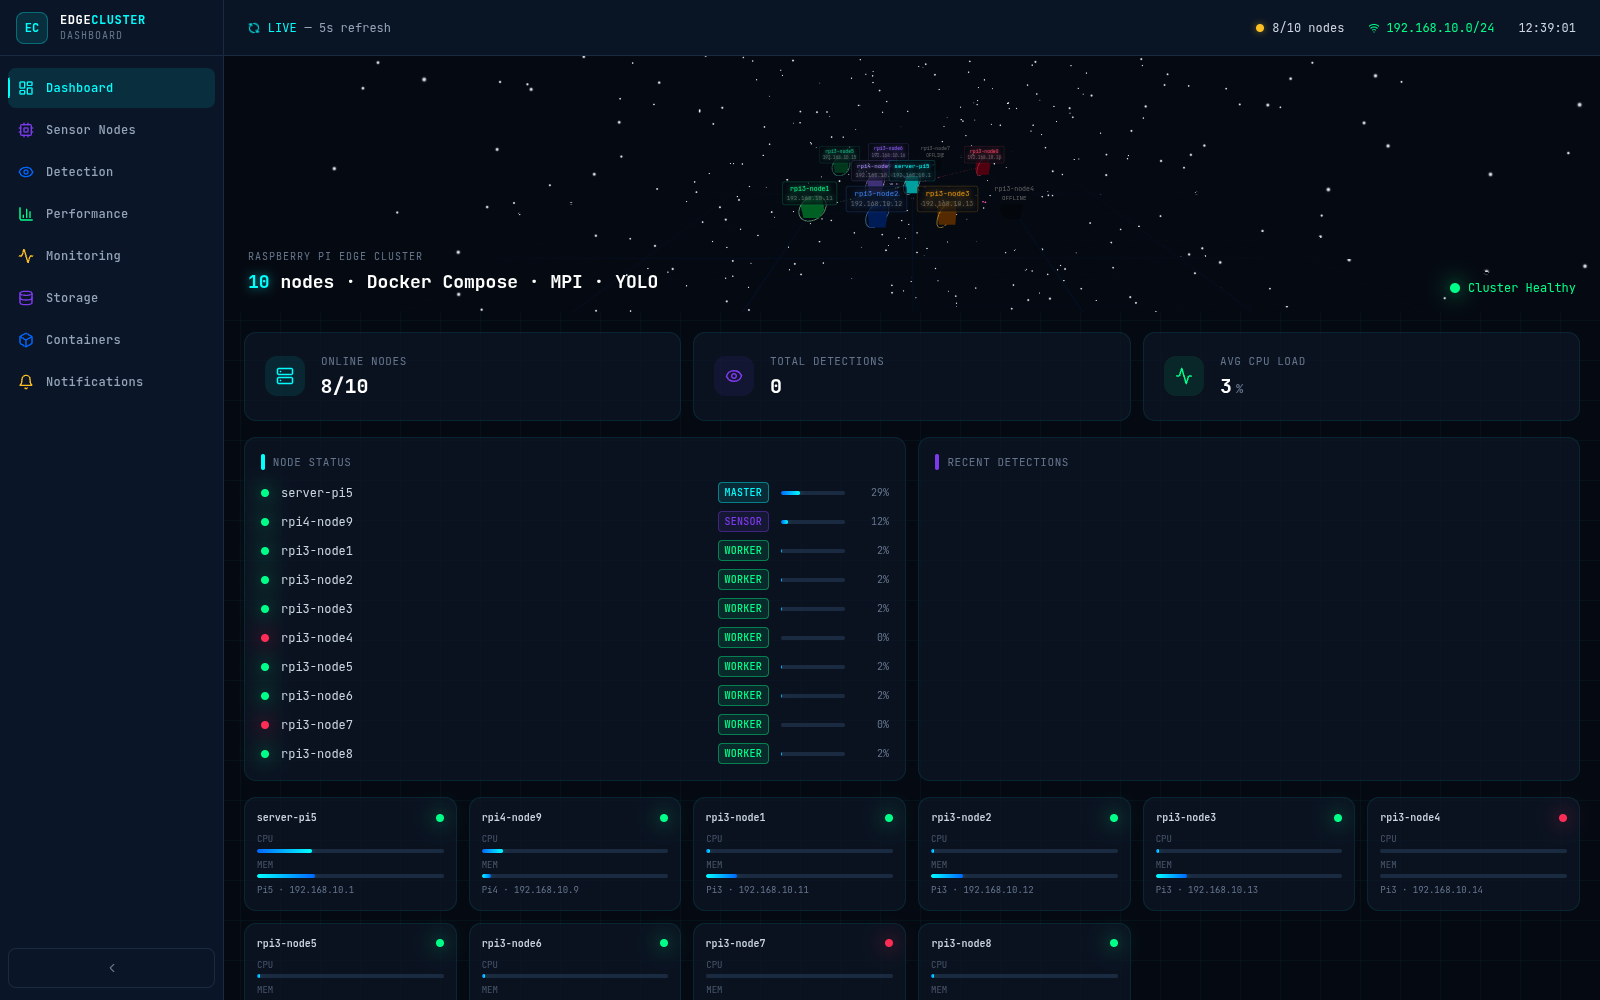
Cluster-wide summary: online node count, total detections, average CPU load, and a 3D scene of the 10-node topology (Pi 5 master, Pi 4 sensor, 8× Pi 3 workers). Node status is driven live from the backend's Prometheus-backed /metrics/nodes endpoint, in both the node list and the 3D scene.
2.2 Sensor Nodes
A card per cluster node with live CPU/memory bars, a CPU history sparkline, and a detail drawer (hardware, network, live metrics, CPU/temperature history) — sourced from GET /metrics/nodes.
2.3 Cluster Monitoring
Cluster-wide metrics: average CPU/memory, max temperature, total network RX, a multi-node CPU history chart (one line per node, labelled and colour-matched via the chart legend/tooltip), a per-node metrics table, and a temperature heatmap. Same /metrics/nodes data source as Sensor Nodes, aggregated differently.
2.4 Object Detection
Two panels working together:
- Live Feed — a continuous MJPEG stream from the Pi 4 sensor camera, relayed through the backend (
GET /stream) so the browser never needs direct network access to the sensor node. - Selected Detection — the snapshot and bounding-box overlay for whichever detection event is selected from the live feed list on the right (defaults to the most recent).
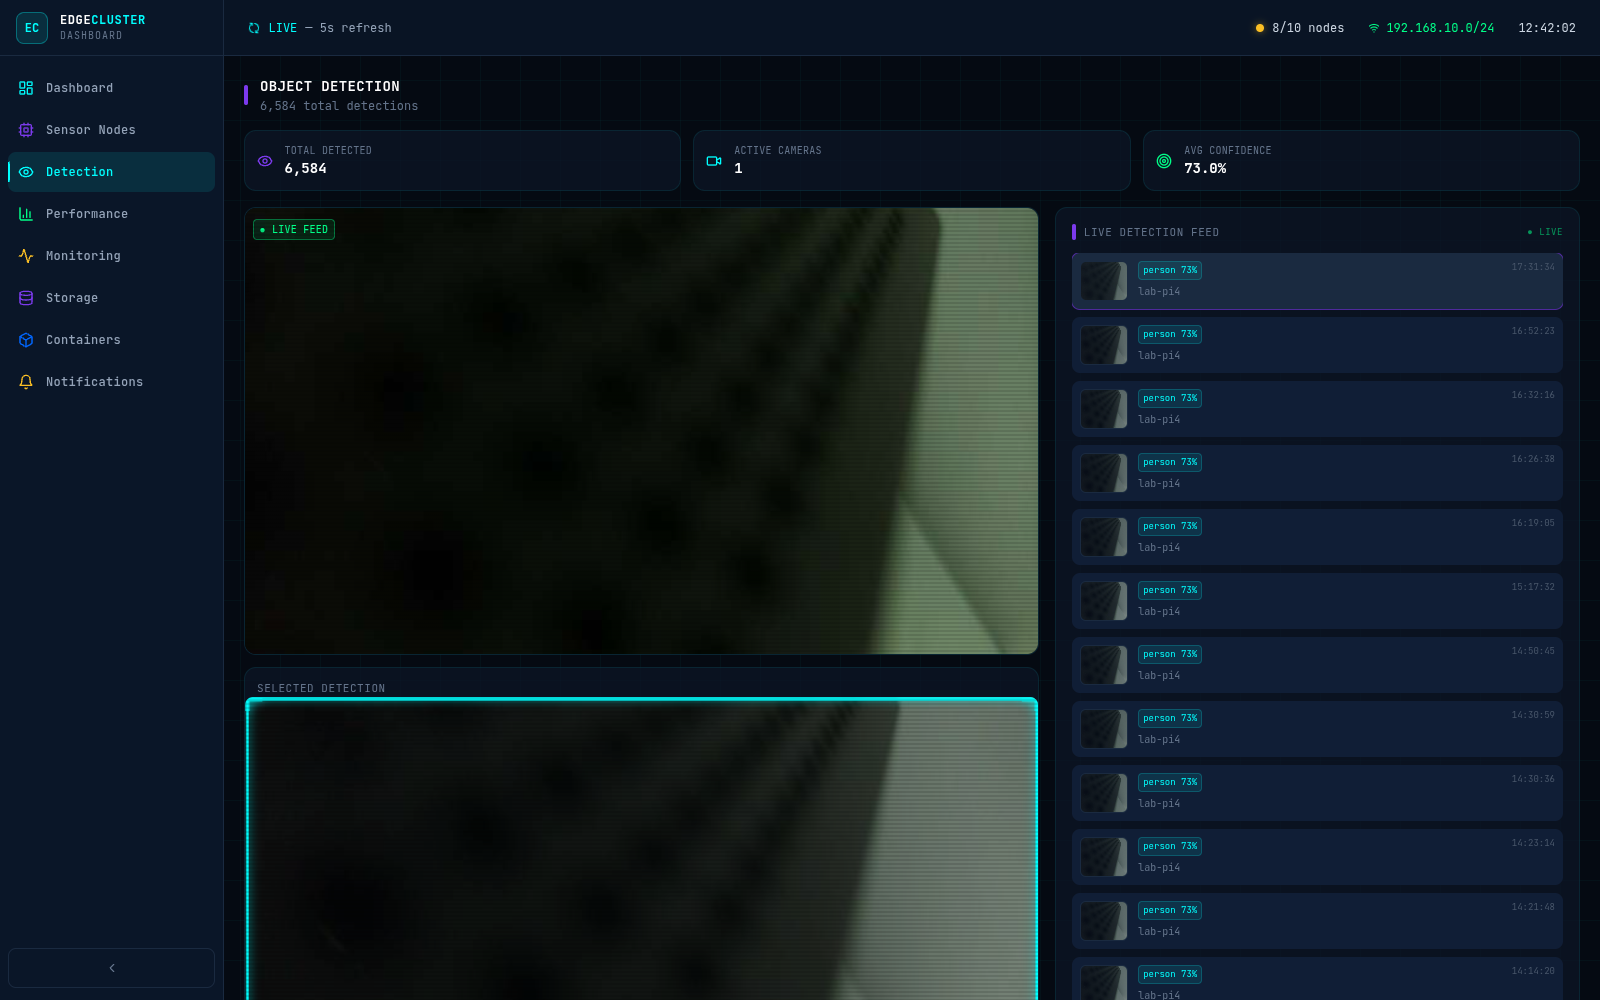
Both panels, and the detection feed list, are driven by the /events and /stream endpoints described in Step 7 (Backend). The feed list is paginated against the backend's /events?page=&limit= endpoint: the newest events load and poll every 5s for new arrivals, and a "load older detections" control pages back through the full stored history.
2.5 Storage
Live disk, database, and snapshot-storage overview for the Pi 5 master: total/used bytes (from Prometheus filesystem metrics), object counts (MongoDB dbStats + snapshot file count), a per-bucket breakdown (detection images on SeaweedFS, event metadata on MongoDB), and a health indicator computed from live disk-usage thresholds. A file browser lists the snapshot images actually on disk.
2.6 Performance
HPL LINPACK, MPI scaling, and Amdahl's/Gustafson's Law visualizations, built from the results produced by Steps 2, 3, and 4:
- HPL results (Step 2) — the full N=8000 strong-scaling sweep (1/2/4/8 workers) plus the documented N=18000 peak (11.81 GFLOPS)
- MPI strong/weak scaling for two example programs, Monte Carlo π and a 1D stencil (Step 3), taken directly from the measured sweep tables (24.45× π speedup, 6.23× stencil speedup at their documented peaks)
- Task Distributor Amdahl/Gustafson results (Step 4), including the negative-scaling result at smaller image sizes that Step 4 uses to illustrate Amdahl's Law
The Amdahl's/Gustafson's Law tabs overlay all three measured datasets on an interactive theoretical curve, so dragging the parallel-fraction slider shows which theoretical assumption best matches each measured example. All series match the corresponding task's measured result tables, so this page and Steps 2–4 report the same numbers.
2.7 Notifications
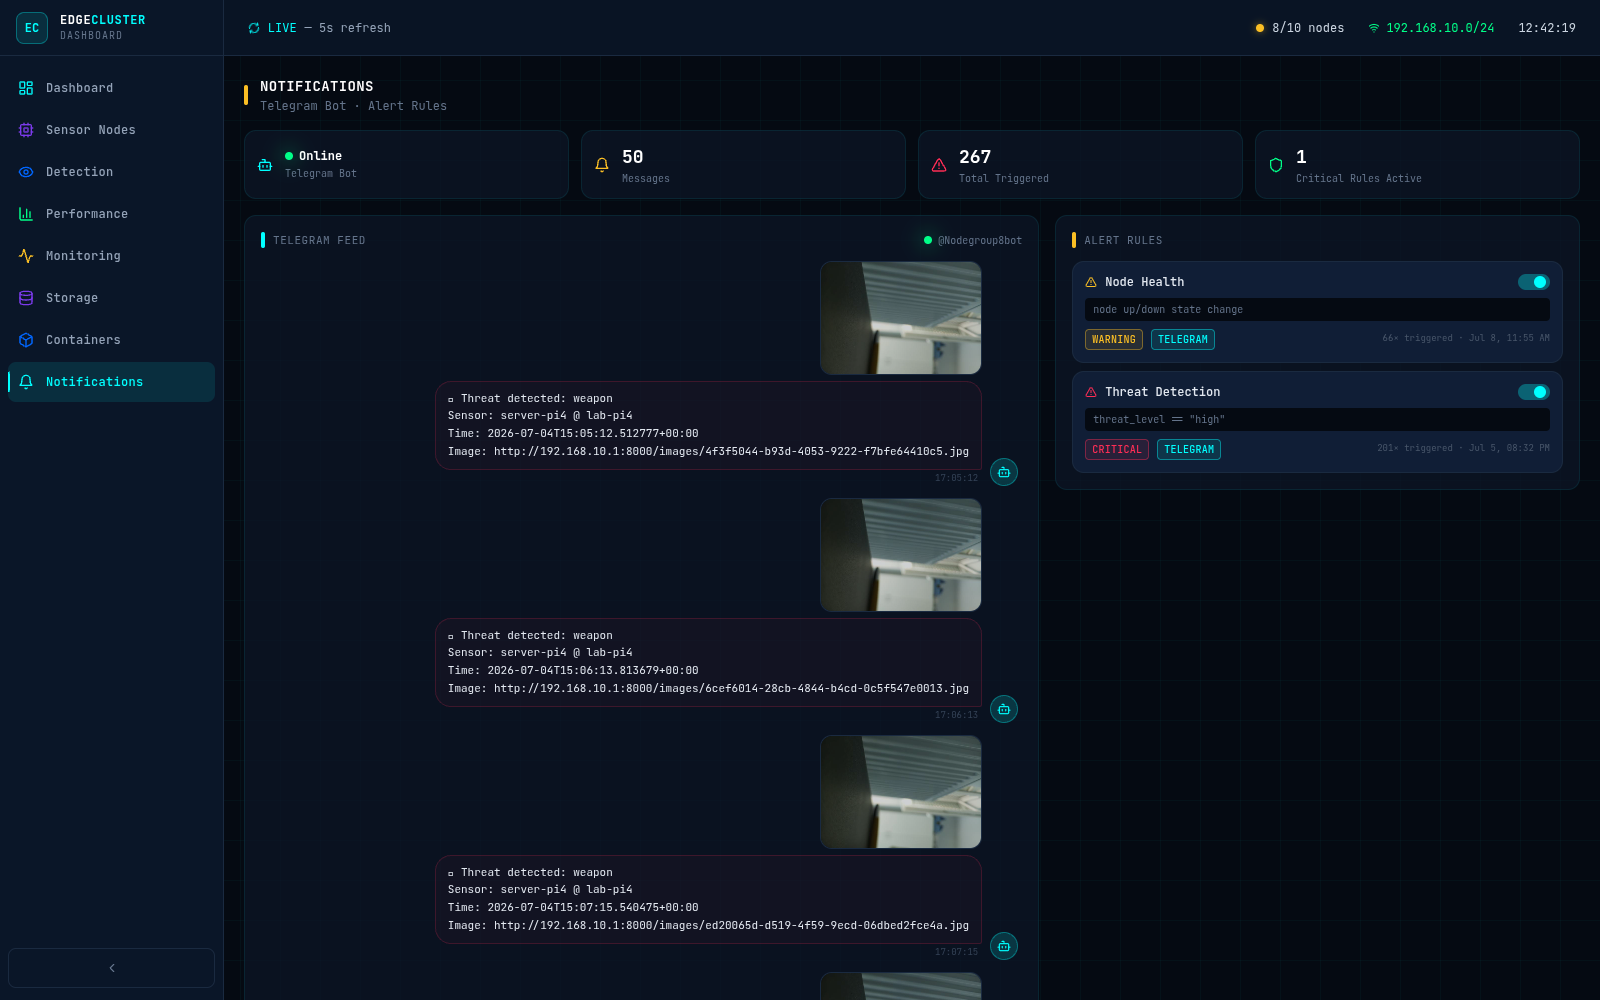
The Telegram bot's message log and alert-rule configuration — see Step 9.
2.8 Containers
Docker container state for the services running on the Pi 5 master (API, database, monitoring stack, storage), sourced from the backend's /services endpoint, plus a per-node capacity view sourced from /metrics/nodes.
3. Running it
Served on port 80 of the Pi 5 master (network_mode: host), reachable at http://<pi5-tailscale-or-lan-ip>/.