Step 5 — Cluster Monitoring & Telemetry
1. Scope and cluster architecture
The objective was to deploy a centralized cluster telemetry and monitoring framework to observe hardware health, core temperatures, system loads, and network traffic across all 10 nodes within the distributed edge computing environment.
| Role | Hardware / identity | Function |
|---|---|---|
| Master | Raspberry Pi 5, server-pi5 |
Runs containerized Prometheus and Grafana |
| Workers | 8 × Raspberry Pi 3, rpi3-node1 to 8 |
Expose hardware metrics via Node Exporter |
| Camera Node | 1 × Raspberry Pi 4, rpi4-node9 |
Exposes sensory node metrics via Node Exporter |
| Network Mode | Host Networking (network_mode: host) |
Bypasses virtual bridges for low-overhead metric scraping |
| Scrape Interval | 15 seconds | Resolution rate for telemetry time-series logging |
All 10 nodes expose metrics on port 9100. Prometheus scrapes each target at 15-second intervals over the cluster subnet.
Network Isolation Note: Because all services utilize host networking mode, standard Docker internal container-name DNS resolution is bypassed. Telemetry collection is carried out directly over the local network switch fabric using raw loopbacks and local DNS mappings.
2. Final design decisions
Bare-Metal Worker Deployment
To guarantee zero-overhead resource tracking on the resource-constrained Raspberry Pi 3 compute pool, Node Exporter is injected as a native daemon directly inside the shared PXE network boot operating system layer rather than using runtime virtualization containers.
Homogeneous OS Automation
By embedding the telemetry collector inside the central PXE boot root image, configuration updates are applied once at the server source and instantly inherited across all worker ranks upon a cluster power cycle.
Host Networking Strategy
Configuring Prometheus and Grafana within the host network space ensures that data scraping tracks actual network card performance, transparently capturing interface statistics without masking traffic inside virtual container bridges.
3. Step-by-step replication procedure
Unless stated otherwise, run all configuration commands from a terminal session on the Pi 5 Master (server-pi5).
3.1 Inject Node Exporter into the PXE Worker Root Image
- Download the official 64-bit Linux ARM binary distribution to a temporary directory on the Master:
cd /tmp
wget https://github.com/prometheus/node_exporter/releases/download/v1.11.1/node_exporter-1.11.1.linux-arm64.tar.gz
tar -xzvf node_exporter-1.11.1.linux-arm64.tar.gz
- Copy the compiled binary directly into the shared network boot operating system path and enforce execution permissions:
sudo cp node_exporter-1.11.1.linux-arm64/node_exporter /nfs/rootfs/usr/bin/
sudo chmod +x /nfs/rootfs/usr/bin/node_exporter
3.2 Automate Telemetry Launch for Compute Worker Boots
- Open the shared filesystem startup script on the Master:
- Insert the execution statement directly above the final
exit 0boundary line.
Reproducibility trap
You must include the trailing ampersand (&) to force the process into the background. Omitting the ampersand causes the foreground systemd initialization pipeline to halt indefinitely if an edge network adapter stutters, plunging the worker node into an unrecoverable boot loop.
3.3 Deploy Telemetry to the Pi 4 Camera Sensor Node
Because the Raspberry Pi 4 Sensory Node boots from its own local storage media, its binary stack must be pushed across the network independently:
- Push the ARM64 binary from the Pi 5 to the Pi 4 temp space:
- Move the binary into the executable path and initialize the background daemon via an SSH bridge command:
ssh -t server-pi4@rpi4-node9 "sudo cp /tmp/node_exporter /usr/bin/node_exporter && sudo chmod +x /usr/bin/node_exporter"
ssh server-pi4@rpi4-node9 "sudo nohup /usr/bin/node_exporter > /dev/null 2>&1 &"
3.4 Build the Master Scrape Configuration File
Save the following configuration as /home/prometheus.yml on the Master node:
global:
  scrape_interval: 15s
  evaluation_interval: 15s

scrape_configs:
  - job_name: 'edge-cluster-infrastructure'
    static_configs:
      - targets:
        - '192.168.10.1:9100'
        - 'rpi3-node1:9100'
        - 'rpi3-node2:9100'
        - 'rpi3-node3:9100'
        - 'rpi3-node4:9100'
        - 'rpi3-node5:9100'
        - 'rpi3-node6:9100'
        - 'rpi3-node7:9100'
        - 'rpi3-node8:9100'
        - 'rpi4-node9:9100'
3.5 Spin Up the Monitoring Service Stack
- Navigate to the core service deployment directory on the Master:
- Initialize the telemetry infrastructure containers:
4. Verification and dashboard outputs
4.1 Validating Scrape Targets
To confirm that all edge hardware daemons are successfully checked into the tracking engine, navigate to the Prometheus status desk via an external browser:
Expected Output: The target collection table must display a state count of 10 / 10 UP. Green status channels verify that the cluster switch routing and host-level daemons are operating normally.
4.2 Grafana Provisioning and UI Linkage
- Connect to the visualization server interface at
http://192.168.10.1:3000(Default credentials:admin / admin). - Navigate to Connections → Data Sources → Add Data Source and select Prometheus.
- Set the connection URL explicitly to bypass internal container spacing:
- Click Save & Test. Click Dashboards → Import. Input the universal ID 1860 and click Load. Select your Prometheus engine entry from the target dropdown menu and click Import.
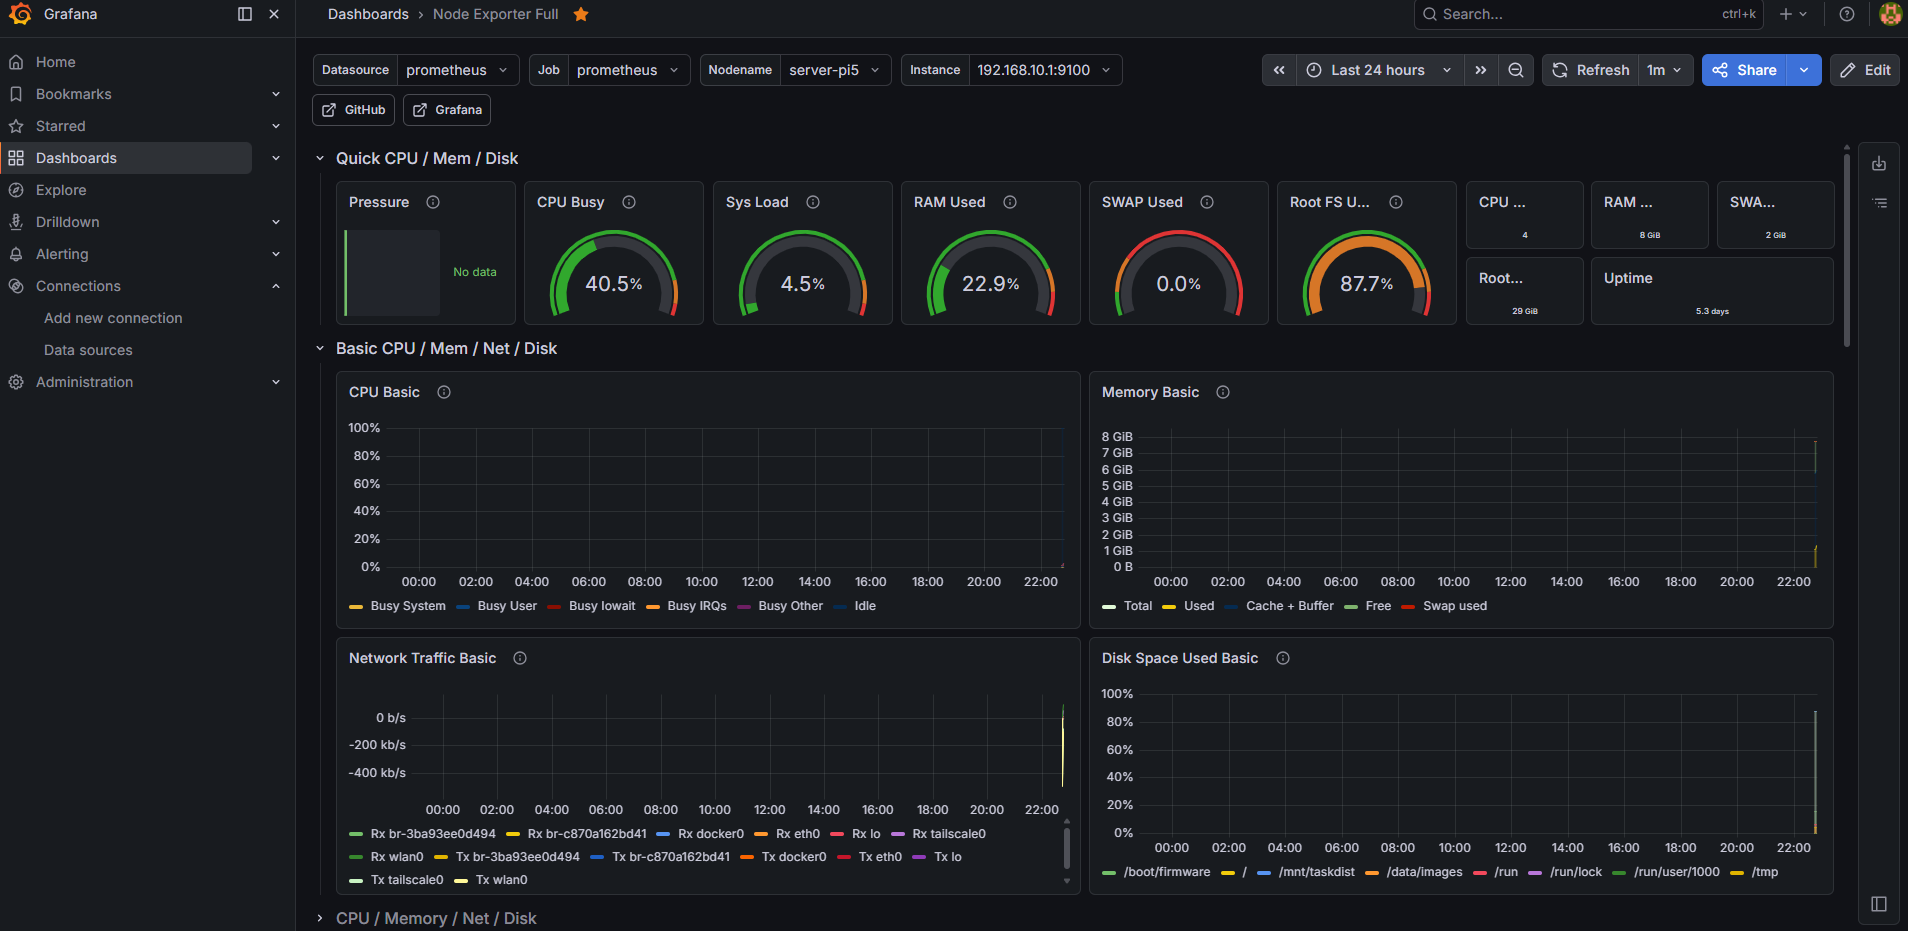
The live dashboard layout will instantly generate real-time metrics, plotting multi-node thread states, individual core temperatures, network interface saturation rates, and memory storage thresholds across the entire cluster fabric.
5. Results
The monitoring stack successfully scrapes all 10 cluster nodes at 15-second intervals.
6. Critical findings and reproducibility traps
The Host Networking Target Illusion
A frequent pitfall during multi-node tracking setups involves deploying Prometheus under network_mode: host while naming metrics targets after container identifiers (e.g., node-exporter:9100). In host networking mode, internal container names do not resolve. Targets must be explicitly declared as the host loopback (192.168.10.1 / 127.0.0.1) or direct subnet bindings mapped via dnsmasq.
Grafana Loopback Refusal
When linking the database to the dashboard interface within an identical host network layer, referencing http://localhost:9090 or http://prometheus:9090 inside the Grafana settings panels will cause authentication dropouts. Grafana interprets localhost as its own container instance rather than the host server. The configuration must specify the physical interface IP: http://192.168.10.1:9090.
The Connection Refused Background SSH Shell Reap
If the Prometheus targets display a red DOWN block accompanied by connect: connection refused, the node_exporter daemon process is not running on the worker nodes. When launching background tasks over non-interactive SSH shells (e.g., ssh server@node "nohup ... &"), the remote Linux kernel reaps backgrounded user tasks the moment the spawning SSH session detaches.
To permanently bypass this, either issue a full cluster restart to force the PXE-booted nodes to evaluate the updated /etc/rc.local natively, or run an interactive terminal override loop (ssh -t ...) to force-trigger the daemons manually for the first time.
7. Complete configuration files
Core Telemetry Service Manifest Block
Excerpt from the core /home/docker-compose.yml stack orchestration mapping:
services:
  prometheus:
    image: prom/prometheus:latest
    container_name: prometheus
    restart: unless-stopped
    network_mode: host
    volumes:
      - ./prometheus.yml:/etc/prometheus/prometheus.yml

  grafana:
    image: grafana/grafana:latest
    container_name: grafana
    restart: unless-stopped
    network_mode: host
    environment:
      - GF_SECURITY_ADMIN_PASSWORD=admin

  node-exporter-master:
    image: prom/node-exporter:latest
    container_name: node-exporter-master
    restart: unless-stopped
    network_mode: host
    volumes:
      - /proc:/host/proc:ro
      - /sys:/host/sys:ro
      - /:/rootfs:ro
    command:
      - '--path.procfs=/host/proc'
      - '--path.rootfs=/rootfs'
      - '--path.sysfs=/host/sys'