Results & Findings
This section provides a consolidated view of benchmark results across tasks. Detailed reproduction steps and full result analysis can be found on each task page.
Task 2 — LINPACK Performance (GFLOPS)
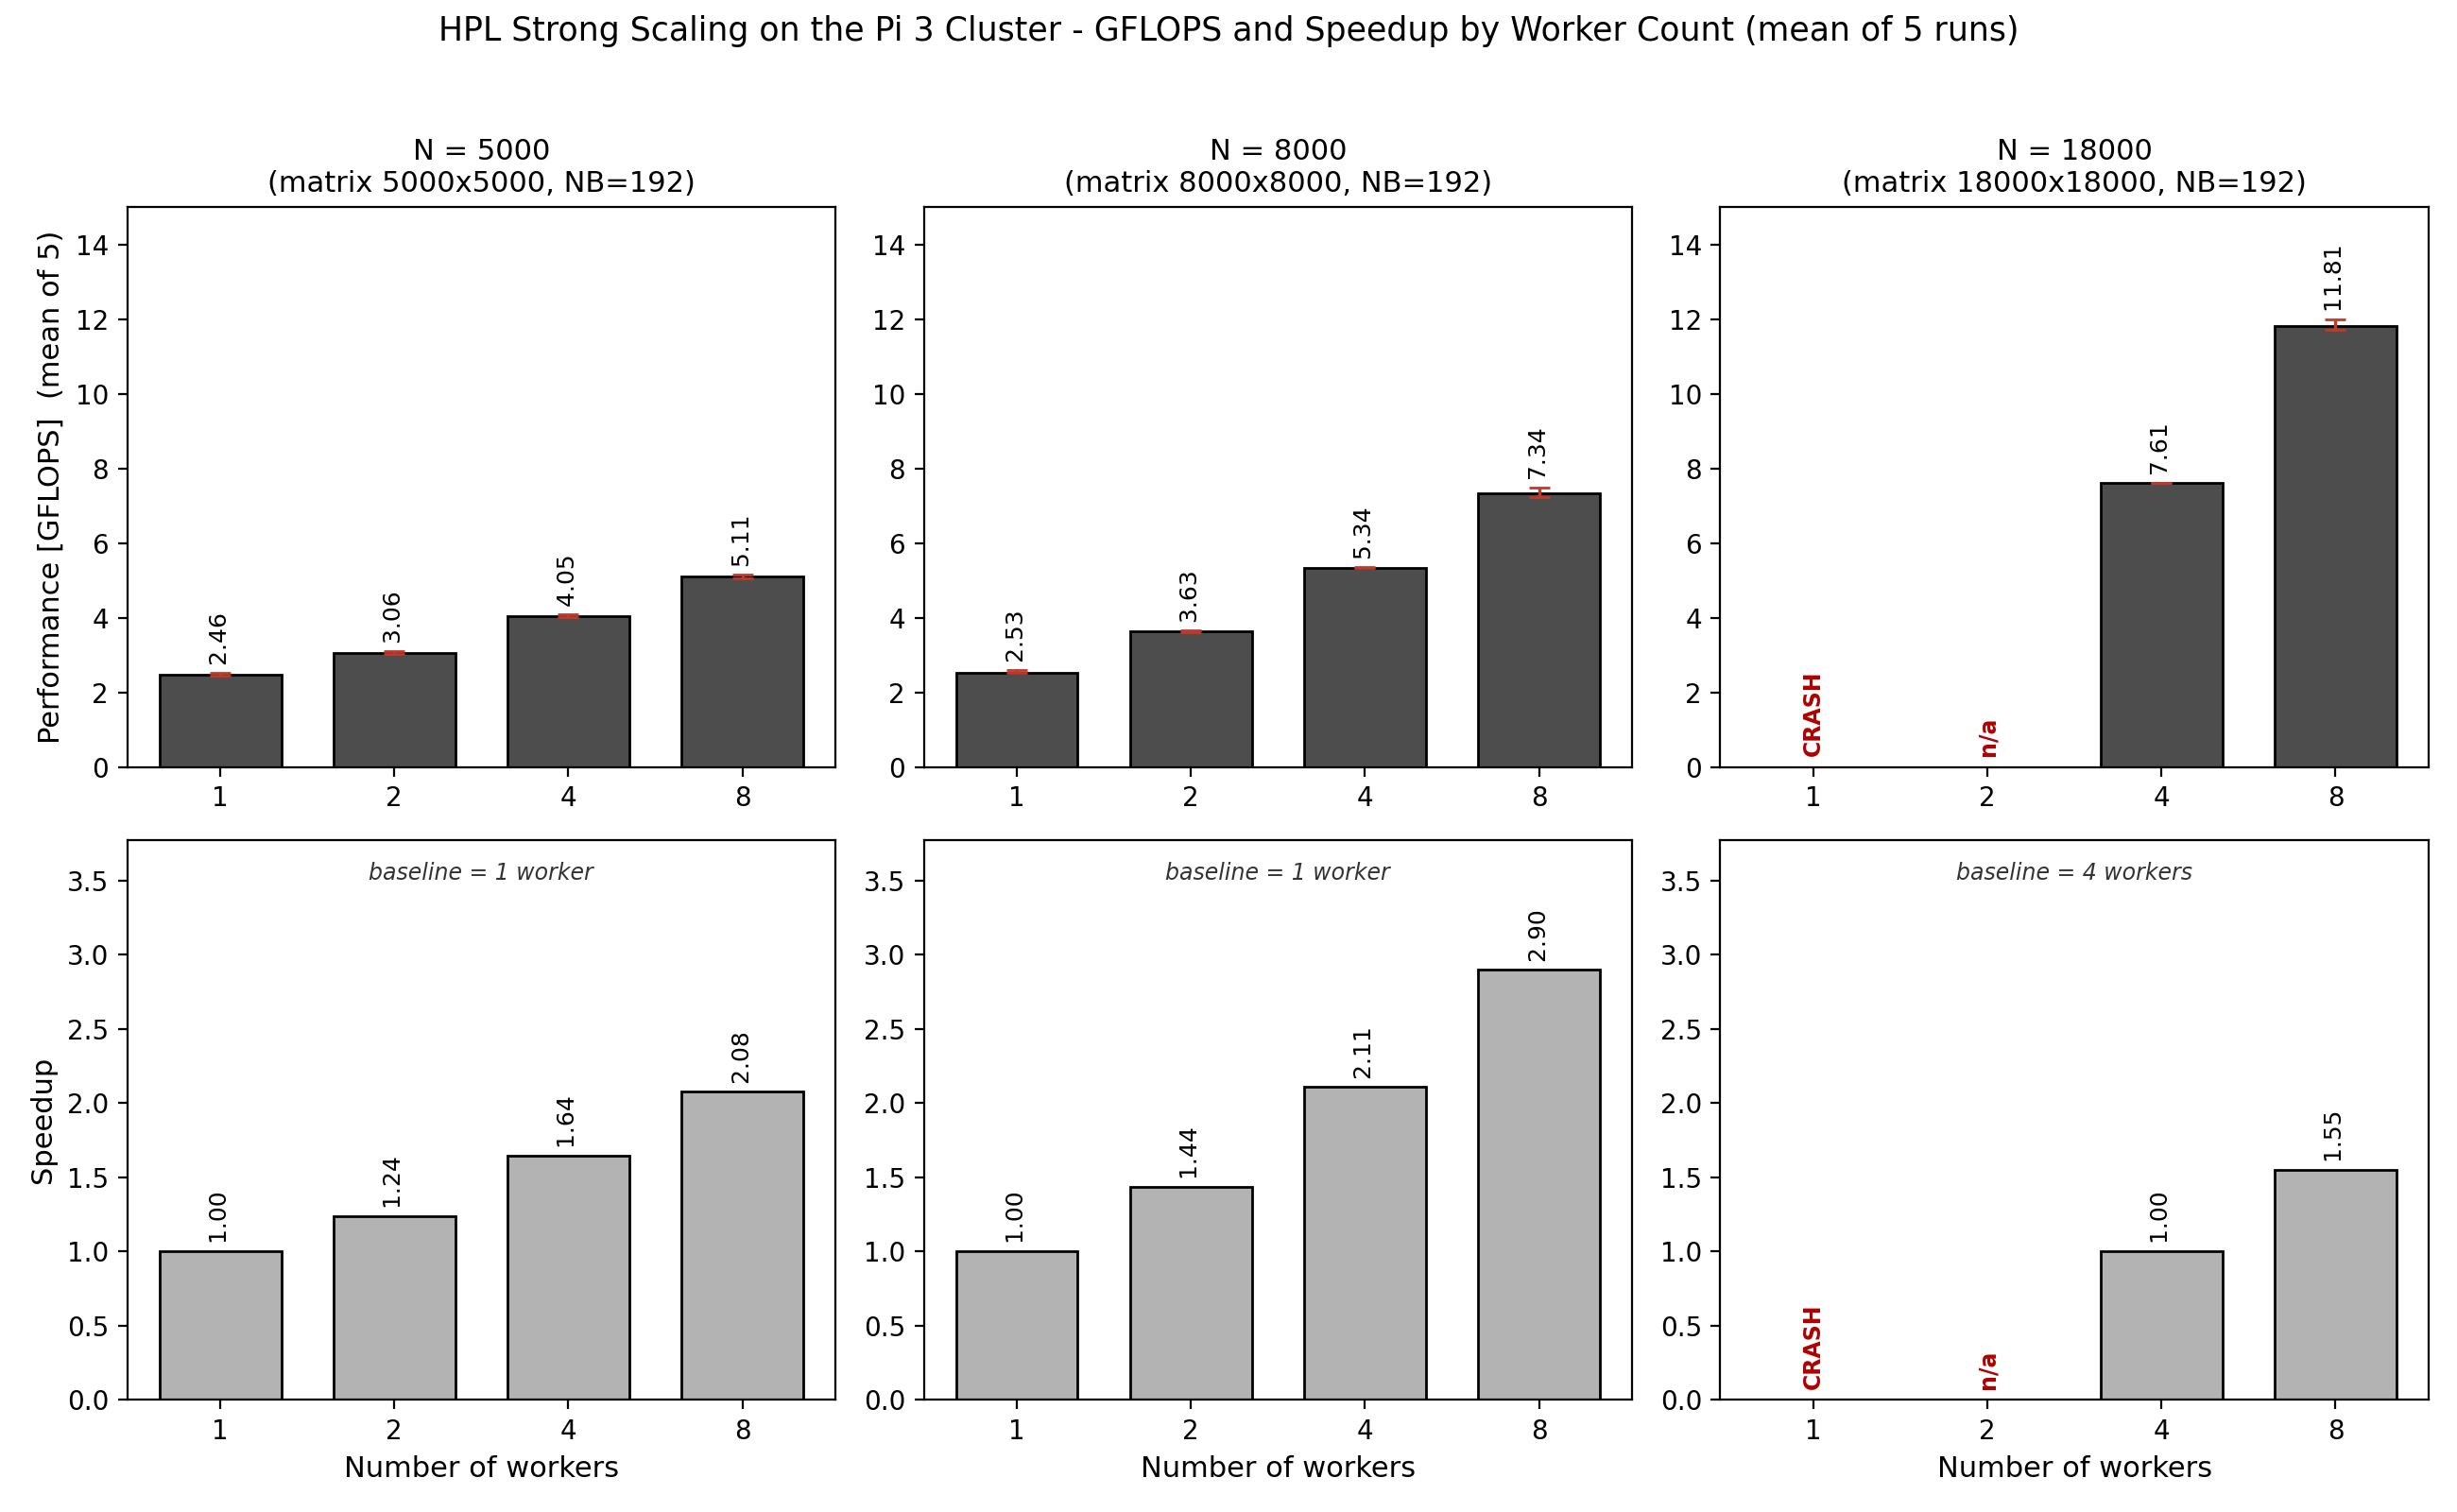
Peak result: 11.81 GFLOPS at N=18000 on 8 Pi 3 nodes (2×4 grid, verified, PASSED). A full strong-scaling sweep was run across N ∈ {5000, 8000, 18000} × {1, 2, 4, 8} workers (5 repeats per cell); the headline configuration is shown below.
| N | Workers | P×Q | GFLOPS | Residual | Status |
|---|---|---|---|---|---|
| 18000 | 1 | 1×1 | — | — | CRASH (OOM) |
| 18000 | 2 | 1×2 | — | — | OOM |
| 18000 | 4 | 2×2 | 7.61 | — | PASSED |
| 18000 | 8 | 2×4 | 11.81 | 3.74e-03 | PASSED |
Task 3 — MPI Scalability
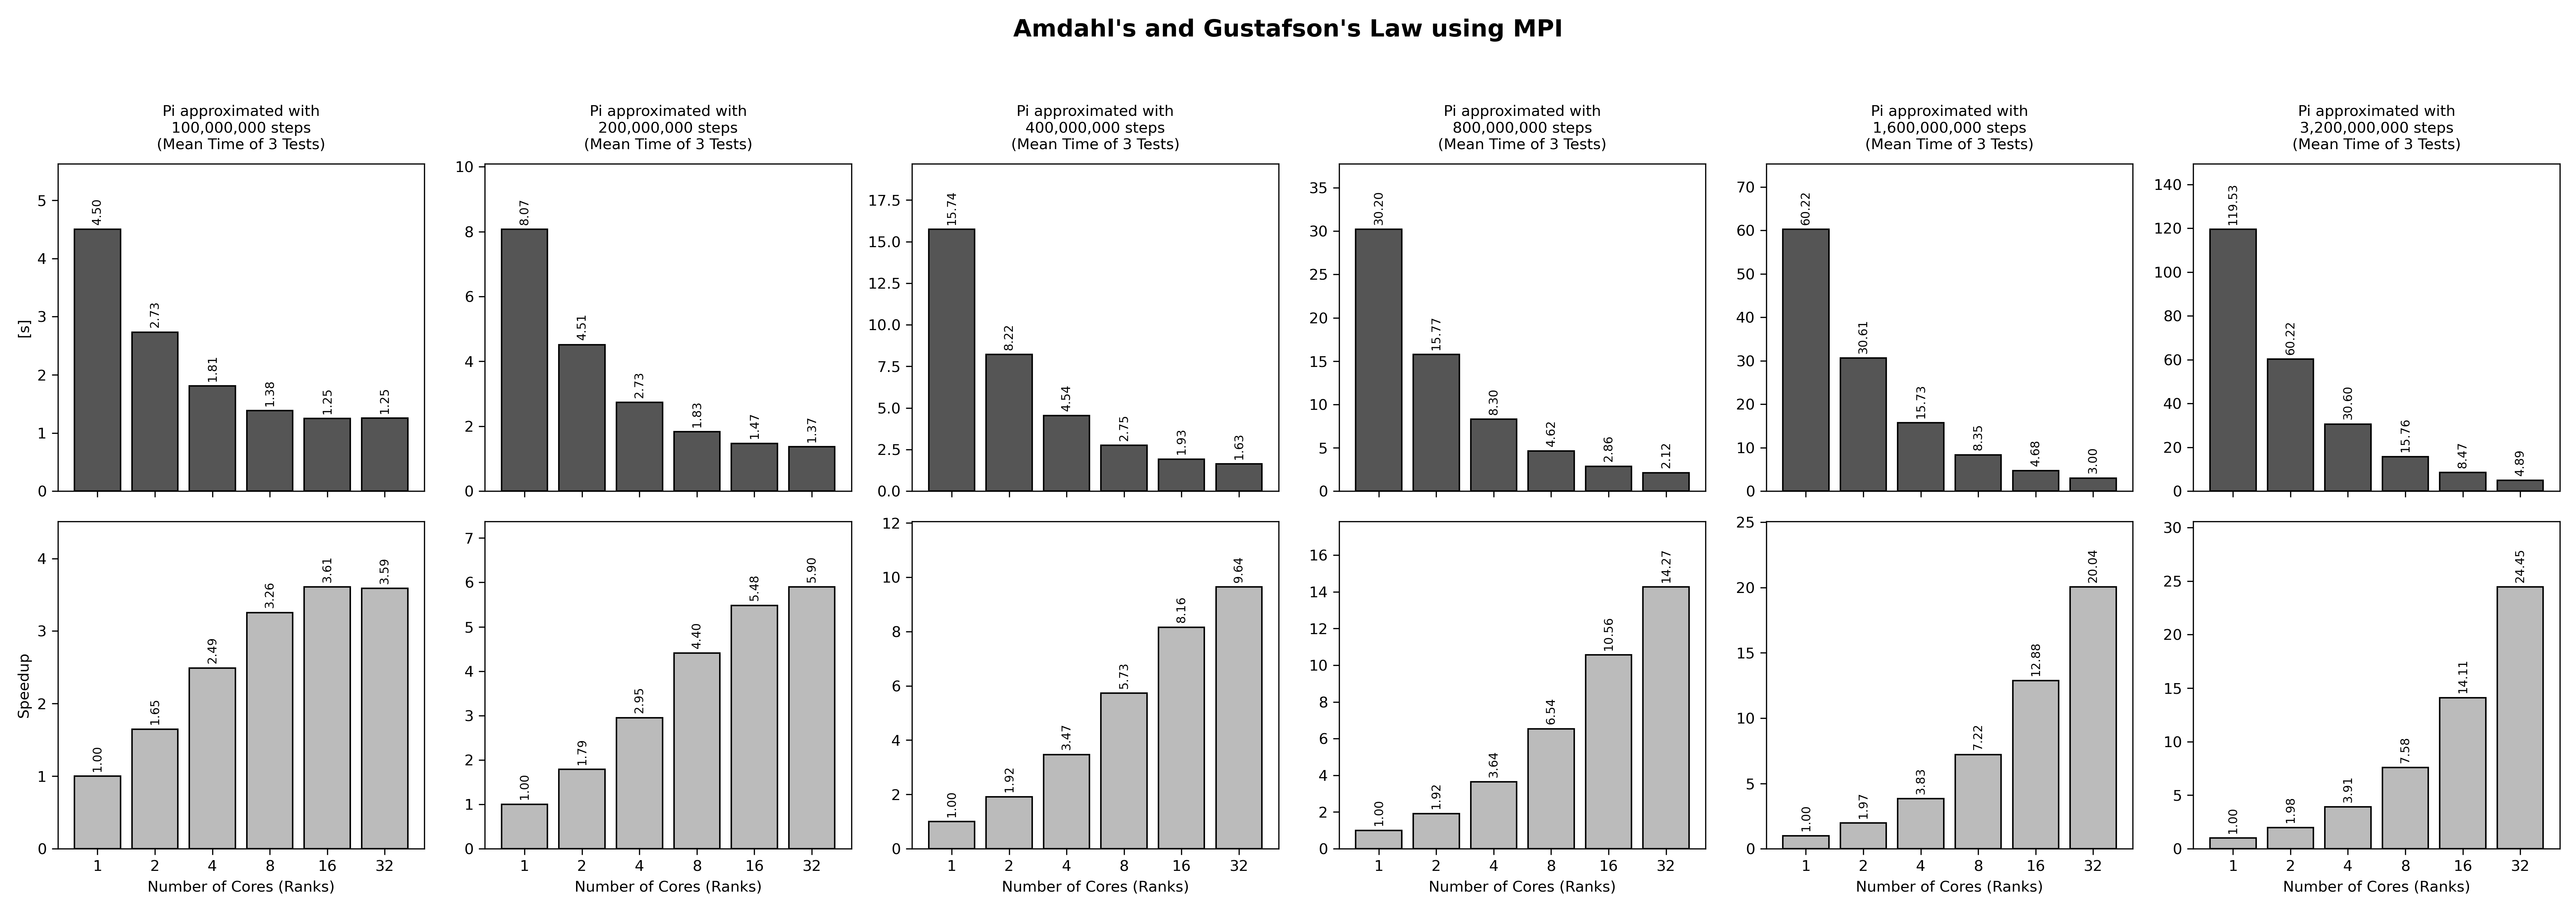
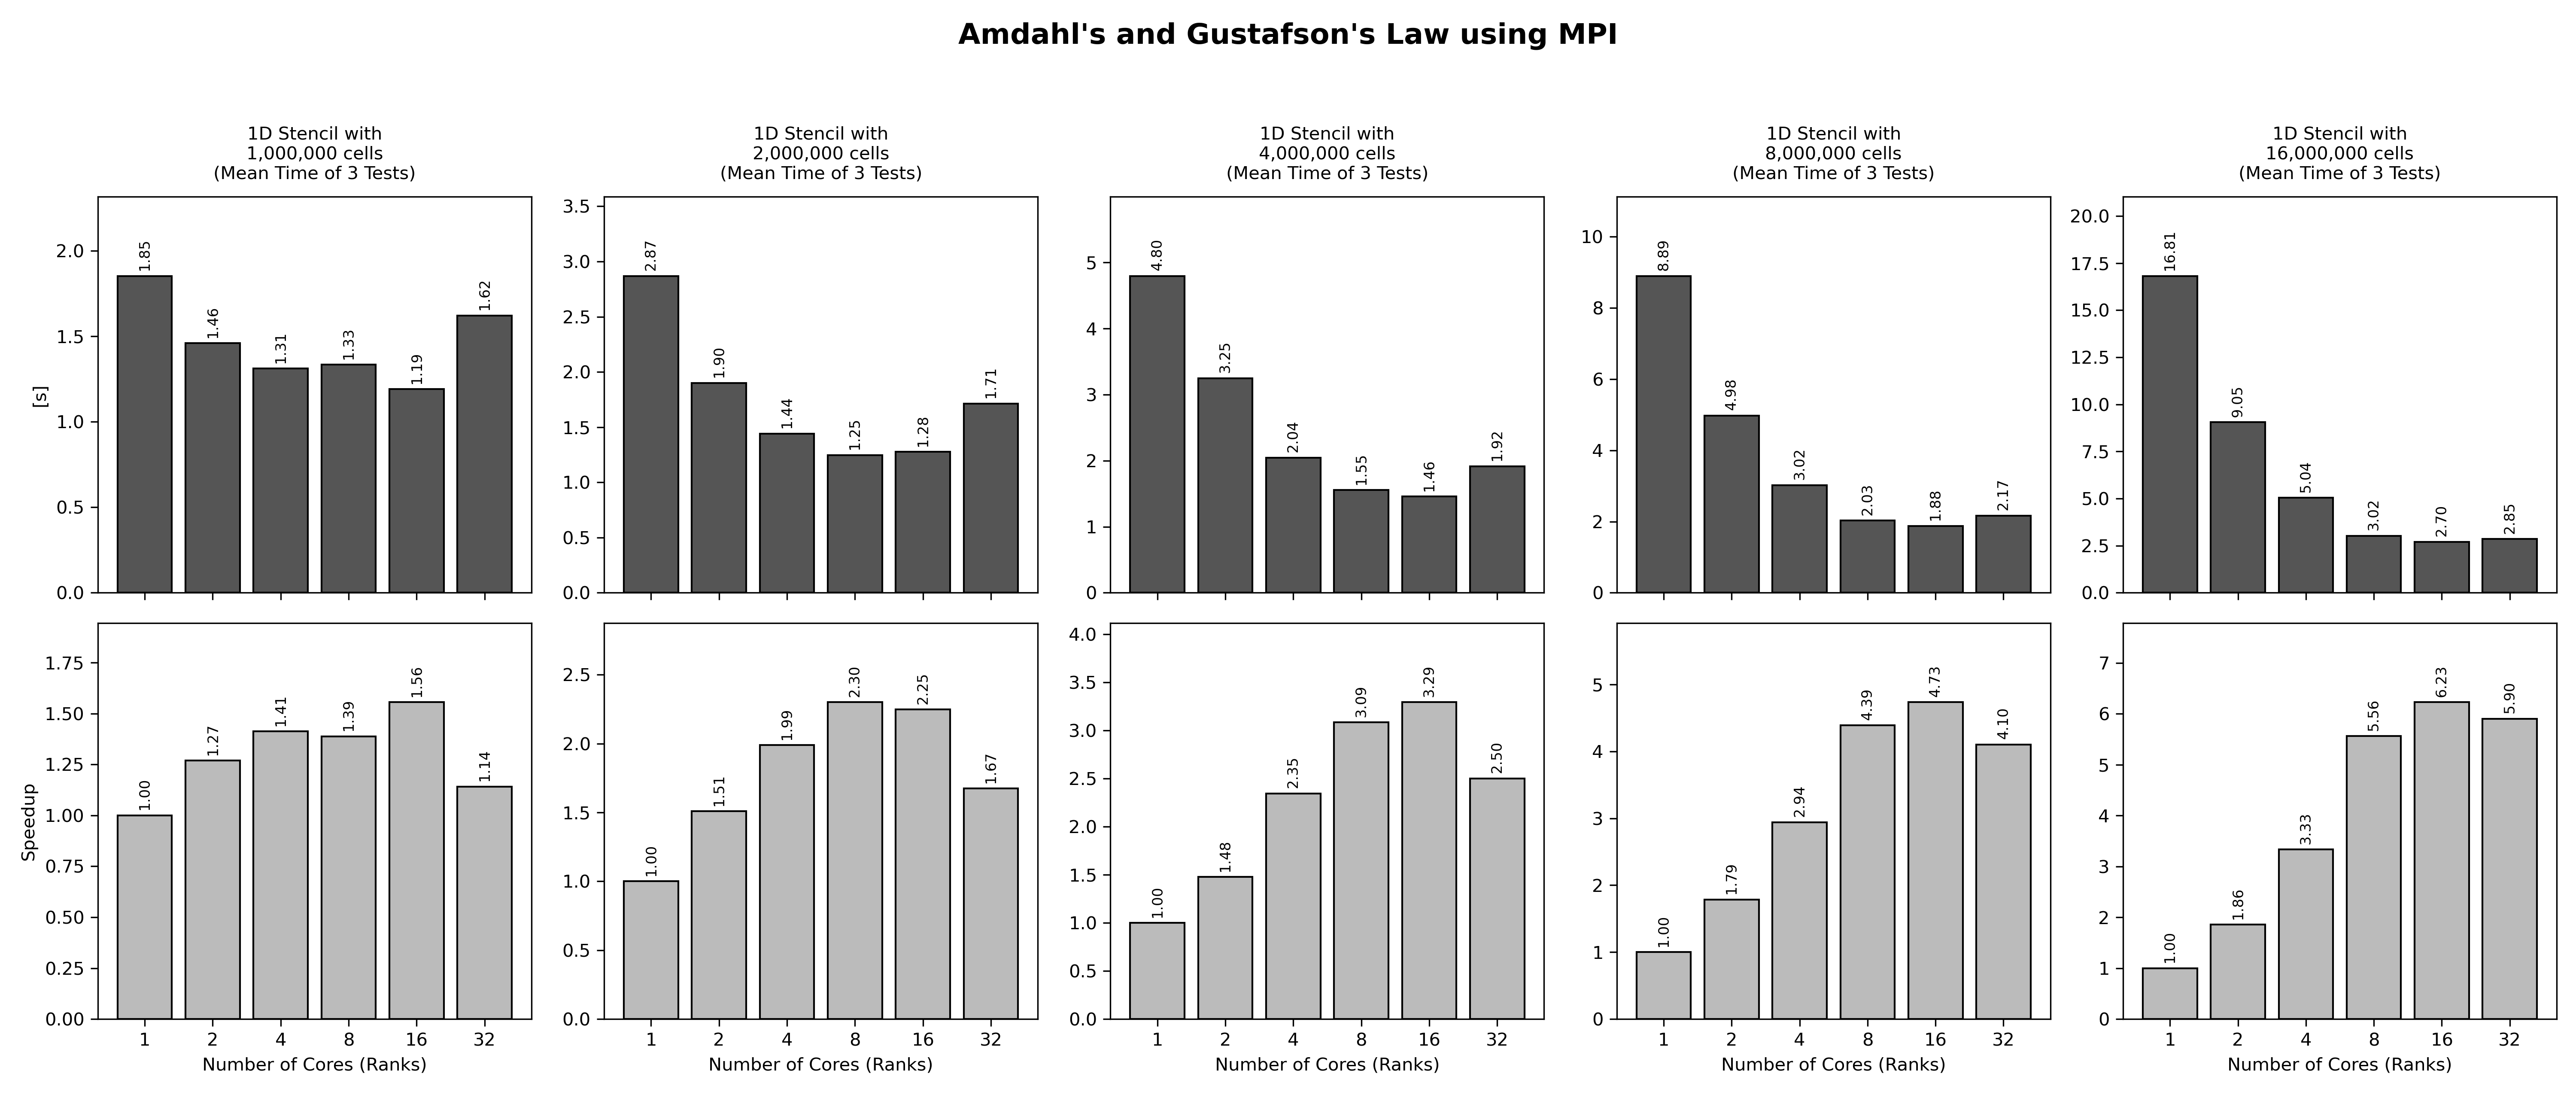
24.45× π strong speedup at 32 ranks — 16 ranks fastest stencil strong configuration — 6.23x Stencil speedup at 16 ranks
Task 4 — Task Distributor (Amdahl/Gustafson)
Amdahl's Law explains why small images scale adversely as you add cores, while Gustafson's Law explains why the exact same architecture successfully achieves positive speedup once you scale the image size up to 3200x2400.
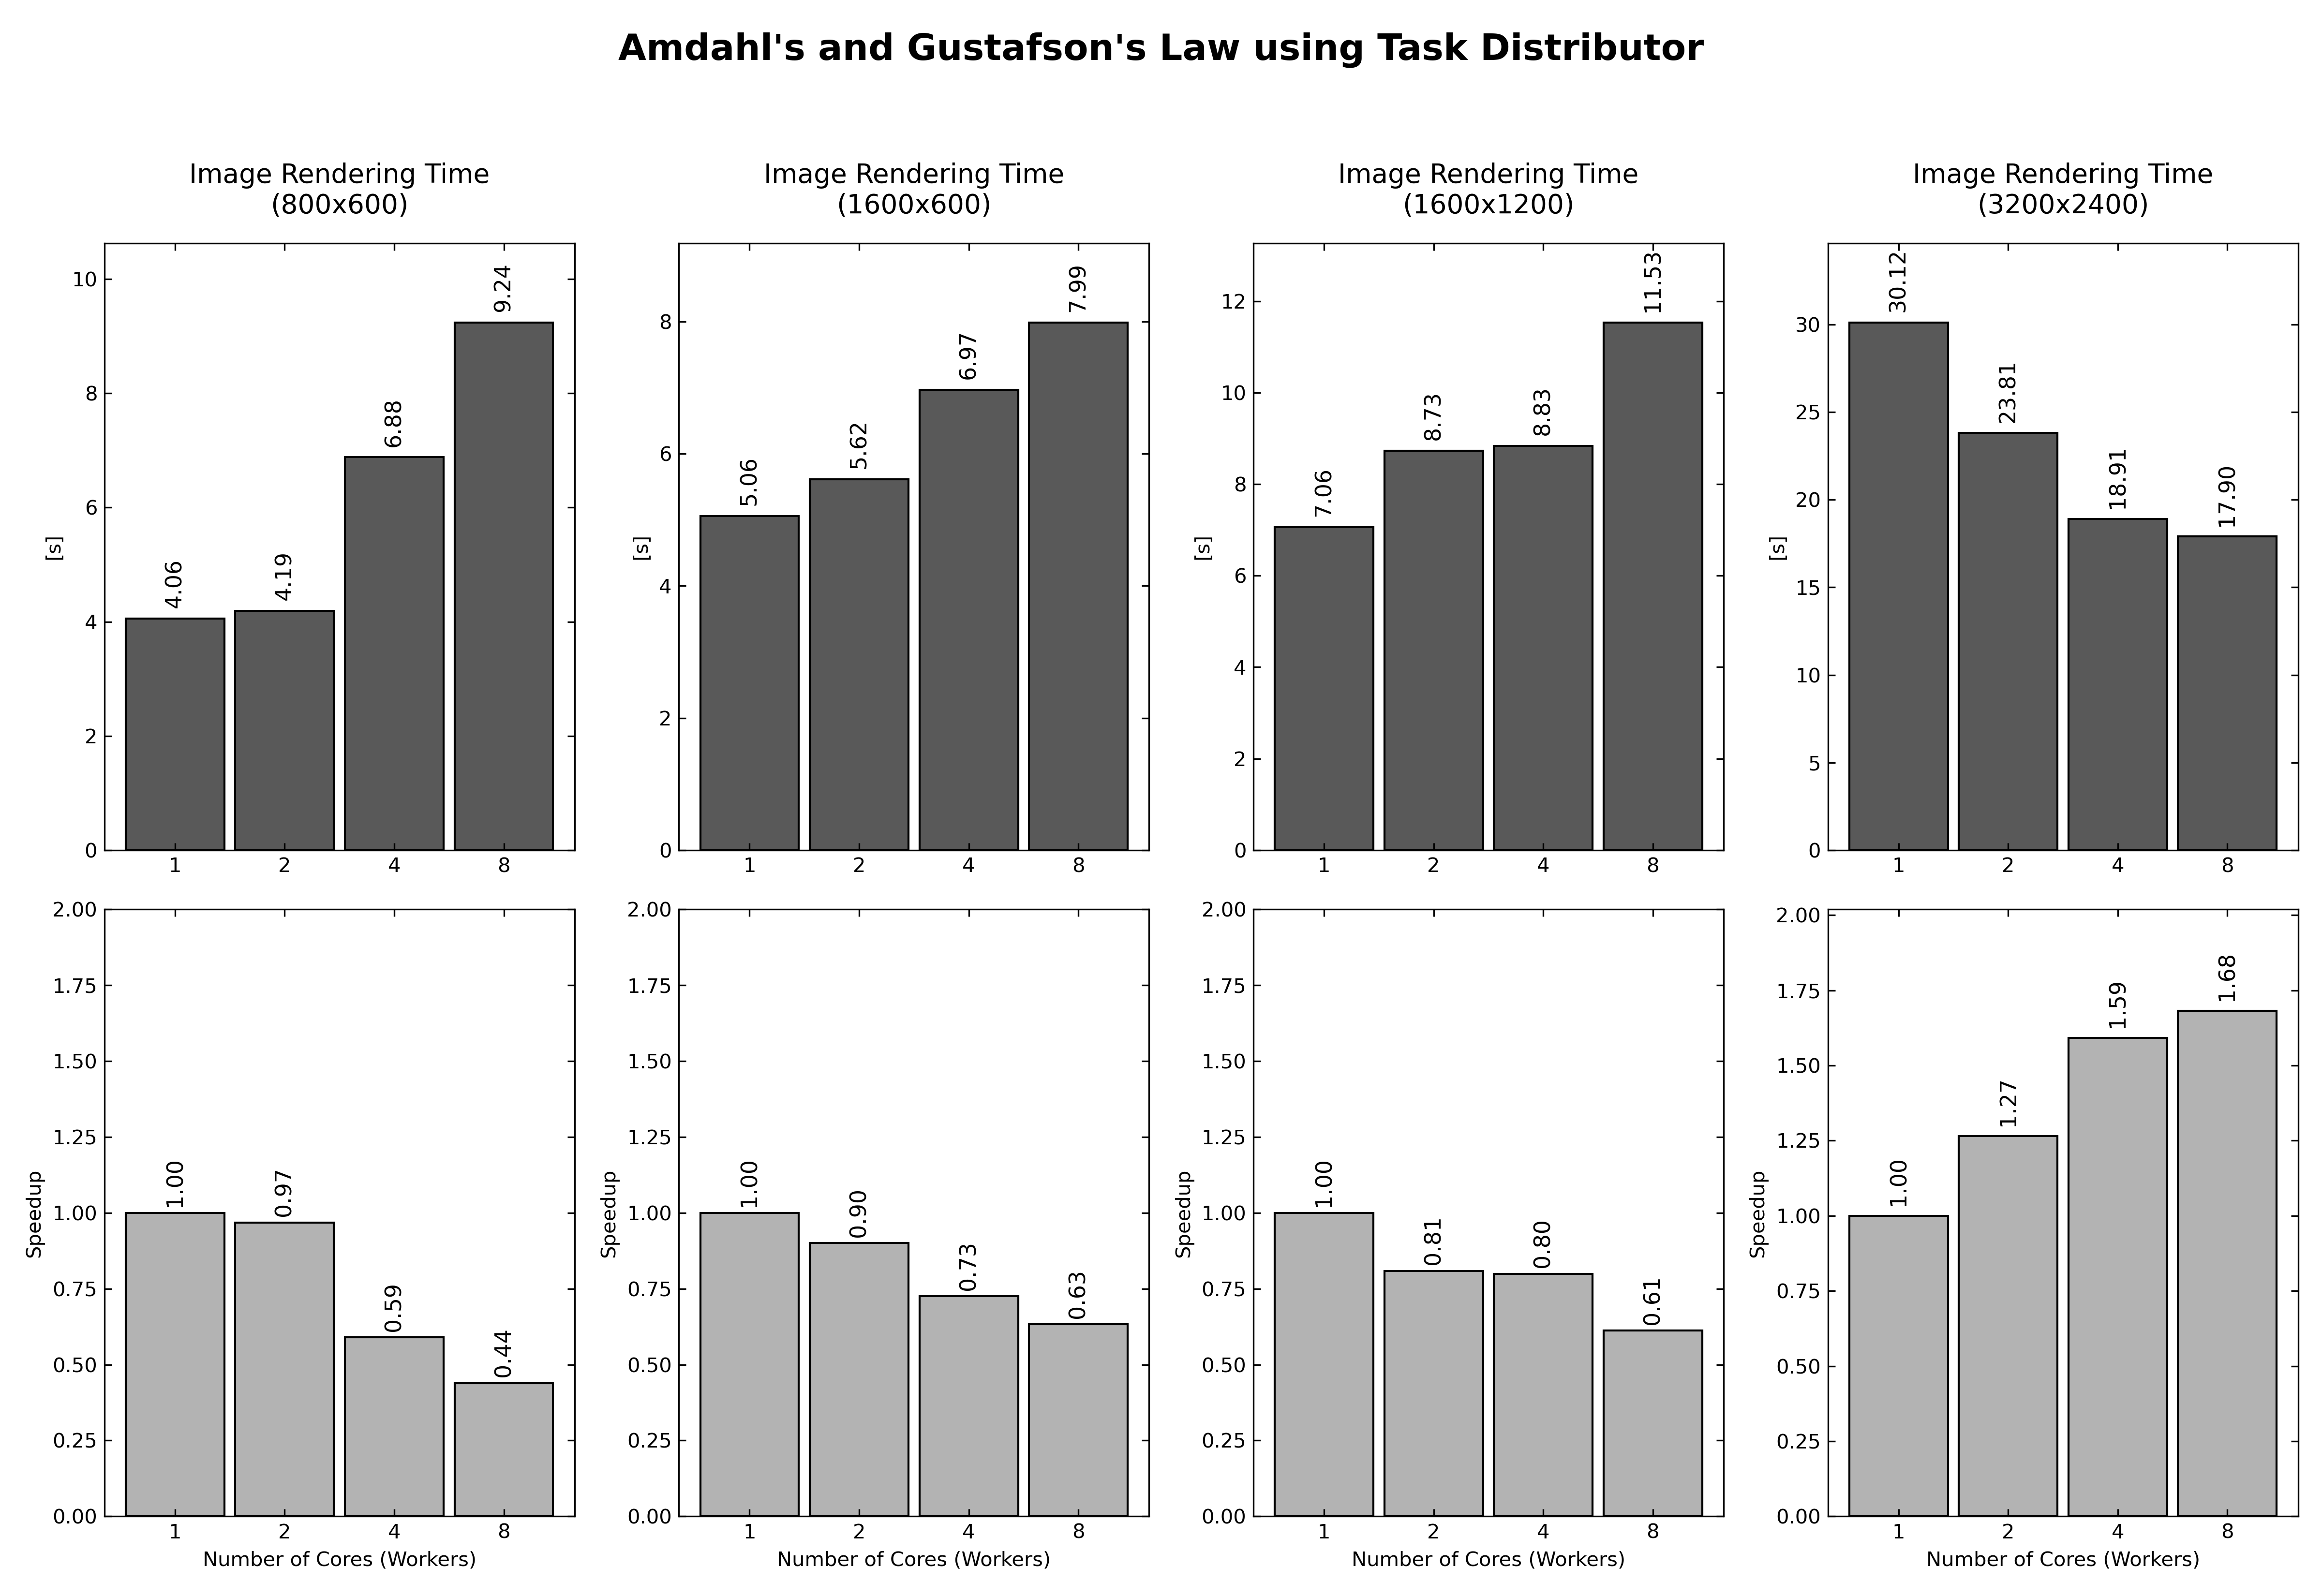
The experiment used a fixed resolution per batch and varied the worker count across 1, 2, 4, and 8 workers.
| Workers | Width | Height | Runs | Average Runtime [s] | Speedup | Efficiency | Serial Fraction Estimate |
|---|---|---|---|---|---|---|---|
| 1 | 800 | 600 | 3 | 4.057 | 1.000 | 1.000 | 0.003 |
| 2 | 800 | 600 | 3 | 4.190 | 0.968 | 0.484 | 0.034 |
| 4 | 800 | 600 | 3 | 6.881 | 0.590 | 0.147 | 0.022 |
| 8 | 800 | 600 | 3 | 9.243 | 0.439 | 0.055 | 0.016 |
| 1 | 1600 | 600 | 3 | 5.057 | 1.000 | 1.000 | 0.002 |
| 2 | 1600 | 600 | 3 | 5.616 | 0.900 | 0.450 | 0.041 |
| 4 | 1600 | 600 | 3 | 6.970 | 0.725 | 0.181 | 0.034 |
| 8 | 1600 | 600 | 3 | 7.989 | 0.633 | 0.079 | 0.029 |
| 1 | 1600 | 1200 | 3 | 7.060 | 1.000 | 1.000 | 0.001 |
| 2 | 1600 | 1200 | 3 | 8.728 | 0.809 | 0.404 | 0.038 |
| 4 | 1600 | 1200 | 3 | 8.832 | 0.799 | 0.200 | 0.049 |
| 8 | 1600 | 1200 | 3 | 11.535 | 0.612 | 0.077 | 0.037 |
| 1 | 3200 | 2400 | 3 | 30.121 | 1.000 | 1.000 | 0.000 |
| 2 | 3200 | 2400 | 3 | 23.806 | 1.265 | 0.633 | 0.044 |
| 4 | 3200 | 2400 | 3 | 18.914 | 1.593 | 0.398 | 0.061 |
| 8 | 3200 | 2400 | 3 | 17.900 | 1.683 | 0.210 | 0.081 |