Step 4 — Task Distributor (Amdahl/Gustafson)
A step-by-step replication guide for a distributed edge computing cluster using one Raspberry Pi 5 master and eight Raspberry Pi 3 worker nodes booted from a shared PXE/NFS root filesystem.
Master node Pi 5, hostname server-pi5
Workers 8 × Pi 3 nodes
Worker rootfs /nfs/rootfs
Worker IPs 192.168.10.101–108
1. Scope and assumptions
This document records the final working procedure used to run Task Distributor on the cluster.
- The Raspberry Pi 5 is used as the master/coordinator only.
- The eight Raspberry Pi 3 nodes are used as worker nodes.
- The Raspberry Pi 4 edge node is excluded from this benchmark.
- All Pi 3 workers already boot successfully from the Pi 5 using PXE/network boot.
- All Pi 3 workers share the same root filesystem located on the master at
/nfs/rootfs. - The worker login user is
server-pi3. - The master cluster IP used by the workers is
192.168.10.1. - The worker static IP range is
192.168.10.101to192.168.10.108. - Containerization is not used. The setup relies on native packages, SSH, NFS, Bash, POV-Ray, ImageMagick, and
bc.
2. Cluster topology
- Pi 5 master: server-pi5, 192.168.10.1
- PXE/NFS rootfs for workers: /nfs/rootfs
- Task Distributor shared workspace: /srv/taskdist
- Local path used by master: /mnt/taskdist
- Task Distributor master script: ~/task-distributor/task-distributor-master.sh
- SSH access to:
- server-pi3@192.168.10.101
- server-pi3@192.168.10.102
- server-pi3@192.168.10.103
- server-pi3@192.168.10.104
- server-pi3@192.168.10.105
- server-pi3@192.168.10.106
- server-pi3@192.168.10.107
- server-pi3@192.168.10.108
- Pi 3 workers
- Boot from the shared PXE rootfs: /nfs/rootfs
- Runtime path for worker script: /home/server-pi3/task-distributor-worker.sh
- Runtime shared workspace mount: /mnt/taskdist
3. Create the shared Task Distributor workspace
Task Distributor needs a shared directory visible to the master and all workers. The actual storage directory is /srv/taskdist on the Pi 5 master. The master and workers both use the runtime path /mnt/taskdist.
3.1 Create the workspace on the master
sudo mkdir -p /srv/taskdist
sudo chown -R server-pi5:server-pi5 /srv/taskdist
sudo chmod 777 /srv/taskdist
3.2 Export the workspace over NFS
Edit the exports file on the master:
Add the export:
Apply the export:
3.3 Bind the workspace locally on the master
Make the bind mount persistent:
3.4 Add the worker mount into the shared PXE rootfs
Create the mount point inside the shared worker rootfs:
Edit the worker rootfs fstab:
Add this line:
3.5 Verify shared storage
echo "hello from master" > /mnt/taskdist/master-text.txt

ssh server-pi3@192.168.10.102 'sudo mount /mnt/taskdist'
ssh server-pi3@192.168.10.102 'cat /mnt/taskdist/master-text.txt'
4. Install NFS client support in the shared PXE rootfs
The worker nodes need the NFS mount helper from nfs-common. Since all workers share the same PXE rootfs, installing it from one PXE-booted worker updates the common worker environment.
Verify that the NFS mount helper exists:
ssh server-pi3@192.168.10.102 'which mount.nfs; dpkg -l nfs-common | grep ^ii'
ls -l /nfs/rootfs/usr/sbin/mount.nfs /nfs/rootfs/sbin/mount.nfs 2>/dev/null
5. Configure passwordless SSH from the master to workers
The master starts worker jobs over SSH, so the master must be able to log in to each worker without a password prompt.
Copy the key to each worker:
Verify passwordless SSH:
6. Install required packages
The master requires Git, ImageMagick, and bc. The workers require POV-Ray, ImageMagick, bc, and NFS client support.
6.1 Master packages
6.2 Worker packages in the shared PXE rootfs
Install the worker-side packages from one running PXE-booted worker:
ssh server-pi3@192.168.10.102 'sudo apt update && sudo apt install -y povray imagemagick bc nfs-common'
Verify the tools from all workers:
for ip in 192.168.10.{101..108}; do
  echo "---- $ip ----"
  ssh server-pi3@$ip 'which povray; which convert; which bc; which mount.nfs'
done
7. Install Task Distributor
Clone Task Distributor on the master:
cd ~
git clone https://github.com/christianbaun/task-distributor.git
cd task-distributor
chmod +x task-distributor-master.sh
Copy the worker script into the shared PXE rootfs. This makes the script available to every Pi 3 worker at runtime.
sudo cp ~/task-distributor/task-distributor-worker.sh /nfs/rootfs/home/server-pi3/
sudo chmod +x /nfs/rootfs/home/server-pi3/task-distributor-worker.sh
sudo chown server-pi3:server-pi3 /nfs/rootfs/home/server-pi3/task-distributor-worker.sh
Verify from the master and from one worker:
ls -l /nfs/rootfs/home/server-pi3/task-distributor-worker.sh
ssh server-pi3@192.168.10.102 'ls -l /home/server-pi3/task-distributor-worker.sh'
8. Configure the Task Distributor scripts
8.1 Configure the master script
Edit the master script:
Set the worker list to the static Pi 3 worker IP addresses:
HOSTS_ARRAY=([1]=192.168.10.101 192.168.10.102 192.168.10.103 192.168.10.104 192.168.10.105 192.168.10.106 192.168.10.107 192.168.10.108)
Set the SSH user:
Set the image path and benchmark scene file:
Set the remote worker script path to the runtime path visible inside each PXE-booted worker:
Use this search command to find the exact locations of these values in the master script:
grep -nE 'HOSTS_ARRAY|USERNAME_SSH|IMG_PATH|IMG_FILE|task-distributor-worker|/home/pi' ~/task-distributor/task-distributor-master.sh
8.2 Configure the worker script in the shared PXE rootfs
Patch the worker script so it uses the package paths and shared workspace used by this cluster:
sudo sed -i 's#/opt/povray/bin/povray_3.7#/usr/bin/povray#g' /nfs/rootfs/home/server-pi3/task-distributor-worker.sh
sudo sed -i 's#/glusterfs/povray#/mnt/taskdist#g' /nfs/rootfs/home/server-pi3/task-distributor-worker.sh
Because the master script uses worker IP addresses in HOSTS_ARRAY, the worker script should write its IP address into the lockfile. Edit the worker script or alternatively if you have static hostnames then update them in step 8.1 accordingly and skip this part:
Use this lockfile update at the end of the worker script:
WORKER_ID=$(hostname -I | awk '{print $1}')
echo "${WORKER_ID} $(date +%Y_%m_%d_%H:%M:%S)" >> /mnt/taskdist/lockfile
Verify the final script references:
grep -nE 'povray|glusterfs|taskdist|opt|hostname|WORKER_ID|lockfile' /nfs/rootfs/home/server-pi3/task-distributor-worker.sh
9. Create the POV-Ray benchmark scene
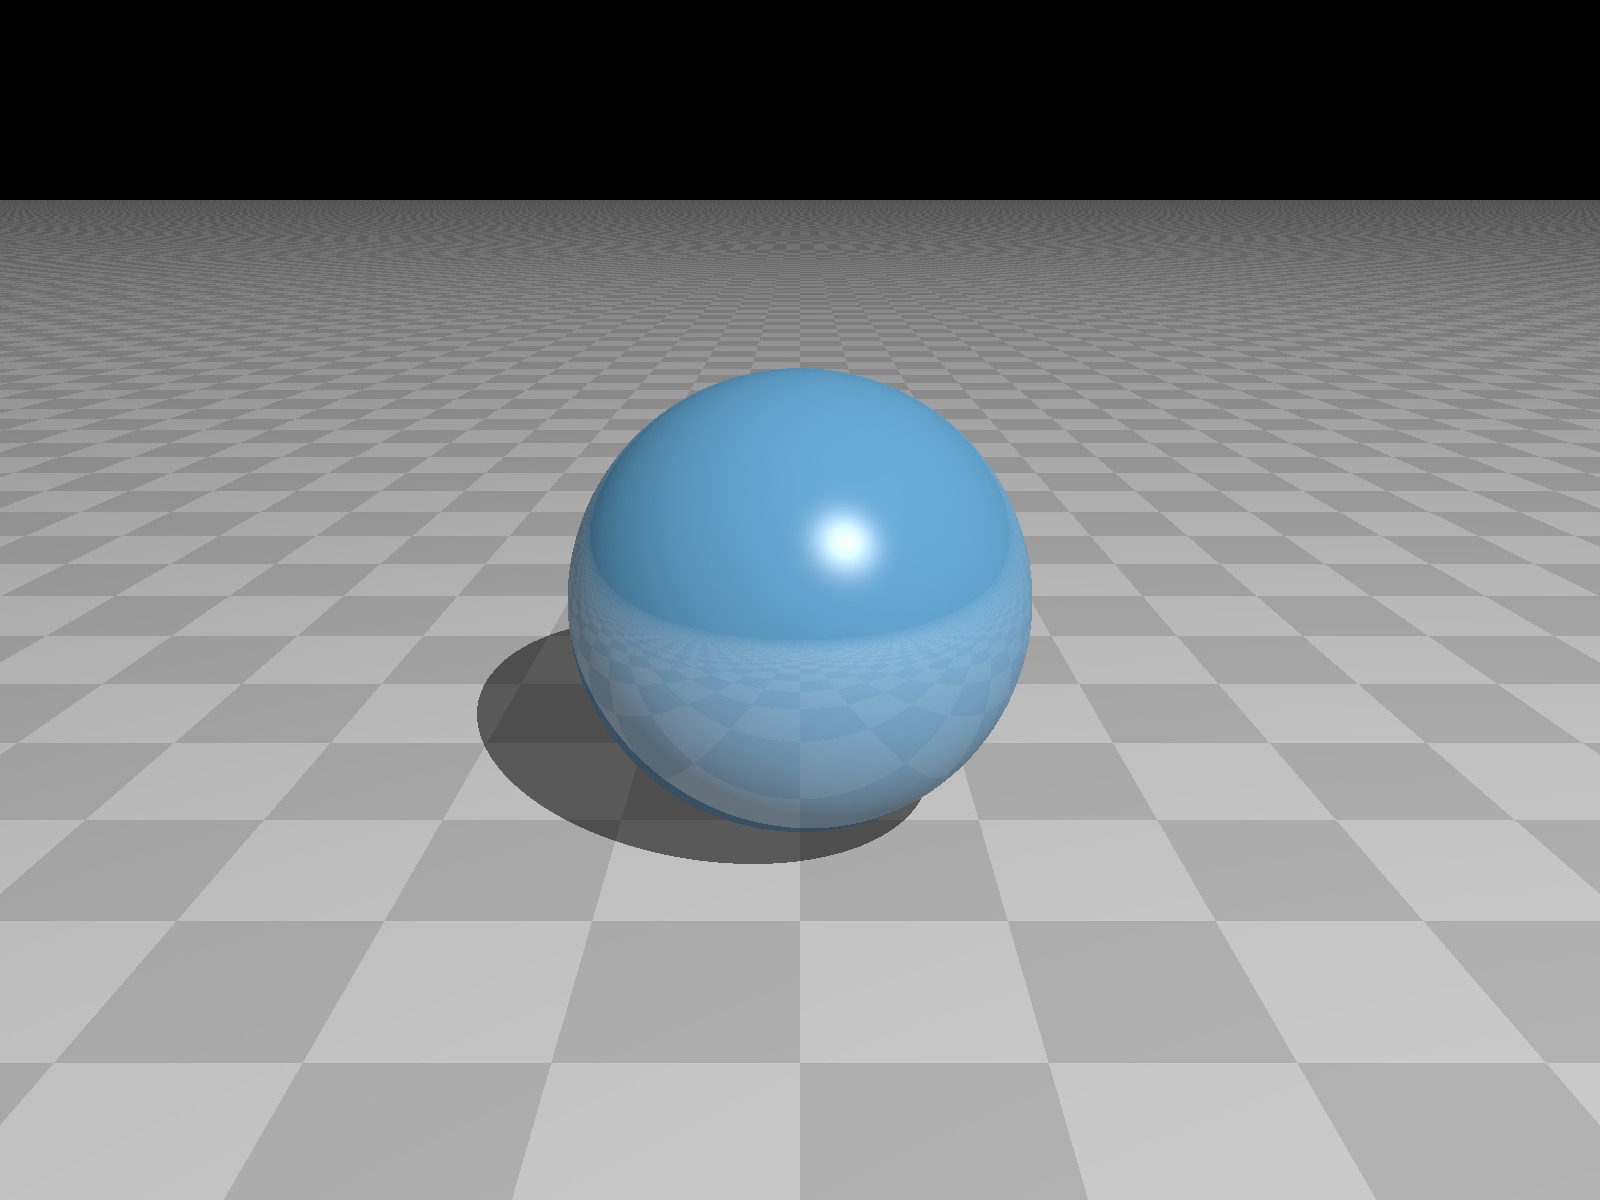
Create a simple scene in the shared workspace. Both master and workers access it through /mnt/taskdist/benchmark.pov.
cat > /mnt/taskdist/benchmark.pov <<'EOF'
#include "colors.inc"

global_settings {
  assumed_gamma 1.0
}

camera {
  location <0, 2, -6>
  look_at <0, 0, 0>
}

light_source {
  <5, 10, -10>
  color White
}

background {
  color Black
}

sphere {
  <0, 0, 0>, 1.2
  texture {
    pigment { color rgb <0.2, 0.6, 1.0> }
    finish { reflection 0.2 phong 0.8 }
  }
}

plane {
  y, -1.3
  texture {
    pigment { checker color White color Gray }
  }
}
EOF
Verify the scene is visible from a worker:
10. Functional test
Run a small test first with one worker, then increase the worker count.
cd ~/task-distributor
rm -f /mnt/taskdist/lockfile
rm -f /mnt/taskdist/*.png

./task-distributor-master.sh -n 1 -x 800 -y 600 -p /mnt/taskdist -f -c
./task-distributor-master.sh -n 2 -x 800 -y 600 -p /mnt/taskdist -f -c
./task-distributor-master.sh -n 4 -x 800 -y 600 -p /mnt/taskdist -f -c
./task-distributor-master.sh -n 8 -x 800 -y 600 -p /mnt/taskdist -f -c
Verify that all workers have the shared workspace mounted:
for ip in 192.168.10.{101..108}; do
  echo "---- $ip ----"
  ssh server-pi3@$ip 'hostname; mount | grep taskdist; ls -l /mnt/taskdist | head'
done
11. Benchmark scripts
cat > ~/task-distributor/run_td.sh <<'EOF'
#!/bin/bash
set -e

cd ~/task-distributor

OUT="performance_data.csv"
SHARED="/mnt/taskdist"
REPEATS=3

echo "workers,width,height,run,total_seconds,seq1_seconds,parallel_seconds,seq2_seconds" > "$OUT"

run_case() {
    workers=$1
    width=$2
    height=$3

    for run in $(seq 1 $REPEATS); do

        echo "Workers=$workers  Resolution=${width}x${height}  Run=$run"

        rm -f "$SHARED"/*.png
        rm -f "$SHARED"/lockfile

        START=$(date +%s.%N)

        LOG=$(./task-distributor-master.sh \
            -n "$workers" \
            -x "$width" \
            -y "$height" \
            -p "$SHARED" \
            -f -c 2>&1)

        END=$(date +%s.%N)

        TOTAL=$(echo "$END - $START" | bc)

        SEQ1=$(echo "$LOG" | grep "1st sequential" | awk '{print $NF}' | tr -d 's')
        PAR=$(echo "$LOG" | grep "parallel part" | awk '{print $NF}' | tr -d 's')
        SEQ2=$(echo "$LOG" | grep "2nd sequential" | awk '{print $NF}' | tr -d 's')

        echo "$workers,$width,$height,$run,$TOTAL,$SEQ1,$PAR,$SEQ2" >> "$OUT"

    done
}

RESOLUTIONS=(
"800 600"
"1600 600"
"1600 1200"
"3200 2400"
)

WORKERS=(1 2 4 8)

for RES in "${RESOLUTIONS[@]}"
do
    set -- $RES

    WIDTH=$1
    HEIGHT=$2

    for W in "${WORKERS[@]}"
    do
        run_case $W $WIDTH $HEIGHT
    done
done

echo "Finished."
echo "Results saved to $OUT"

EOF

chmod +x ~/task-distributor/run_td.sh
~/task-distributor/run_td.sh
12. Analysis script and metrics
The analysis calculates average runtime, speedup, efficiency, and scaled-workload throughput metrics from the generated CSV files.
12.1 Reusable analysis script
cat > ~/task-distributor/analyze_results.py <<'EOF'
#!/usr/bin/env python3

"""
Analyze Task Distributor benchmark results.

Input:
    performance_data.csv

Columns expected:

workers,width,height,run,total_seconds,seq1_seconds,parallel_seconds,seq2_seconds

Example:
1,800,600,1,14.53,0.91,12.84,0.78

Output directory:
analysis/

For every resolution:
    summary_<WxH>.csv
    <WxH>_runtime.png
    <WxH>_speedup.png
    <WxH>_efficiency.png
    <WxH>_seconds_per_megapixel.png
    <WxH>_throughput.png
    <WxH>_table.png
"""

import csv
from pathlib import Path
from collections import defaultdict
from statistics import mean

import matplotlib.pyplot as plt


INPUT_CSV = "performance_data.csv"
OUTPUT_DIR = Path("analysis")
OUTPUT_DIR.mkdir(exist_ok=True)


###############################################################################
# Read CSV
###############################################################################

rows = []

with open(INPUT_CSV, newline="") as f:
    reader = csv.DictReader(f)

    for row in reader:
        row["workers"] = int(row["workers"])
        row["width"] = int(row["width"])
        row["height"] = int(row["height"])
        row["run"] = int(row["run"])

        row["total_seconds"] = float(row["total_seconds"])
        row["seq1_seconds"] = float(row["seq1_seconds"])
        row["parallel_seconds"] = float(row["parallel_seconds"])
        row["seq2_seconds"] = float(row["seq2_seconds"])

        rows.append(row)


###############################################################################
# Group by resolution
###############################################################################

resolution_groups = defaultdict(list)

for r in rows:
    resolution_groups[(r["width"], r["height"])].append(r)


###############################################################################
# Analyze each resolution independently
###############################################################################

for (width, height) in sorted(resolution_groups.keys()):

    items = resolution_groups[(width, height)]

    worker_groups = defaultdict(list)

    for item in items:
        worker_groups[item["workers"]].append(item)

    baseline_runtime = mean(
        r["total_seconds"]
        for r in worker_groups[1]
    )

    megapixels = (width * height) / 1_000_000

    baseline_throughput = megapixels / baseline_runtime

    summary = []

    for workers in sorted(worker_groups.keys()):

        data = worker_groups[workers]

        avg_total = mean(d["total_seconds"] for d in data)
        avg_seq1 = mean(d["seq1_seconds"] for d in data)
        avg_parallel = mean(d["parallel_seconds"] for d in data)
        avg_seq2 = mean(d["seq2_seconds"] for d in data)

        speedup = baseline_runtime / avg_total

        efficiency = speedup / workers

        seconds_per_mp = avg_total / megapixels

        throughput = megapixels / avg_total

        throughput_speedup = throughput / baseline_throughput

        serial_fraction = (avg_seq1 + avg_seq2) / avg_total

        summary.append({
            "workers": workers,
            "width": width,
            "height": height,
            "avg_total_seconds": avg_total,
            "avg_seq1_seconds": avg_seq1,
            "avg_parallel_seconds": avg_parallel,
            "avg_seq2_seconds": avg_seq2,
            "speedup": speedup,
            "efficiency": efficiency,
            "seconds_per_megapixel": seconds_per_mp,
            "throughput_mp_per_sec": throughput,
            "throughput_speedup": throughput_speedup,
            "serial_fraction_estimate": serial_fraction
        })

    ###########################################################################
    # Save summary CSV
    ###########################################################################

    csv_name = OUTPUT_DIR / f"summary_{width}x{height}.csv"

    with open(csv_name, "w", newline="") as f:

        writer = csv.DictWriter(
            f,
            fieldnames=summary[0].keys()
        )

        writer.writeheader()

        writer.writerows(summary)

    ###########################################################################
    # Convenience arrays
    ###########################################################################

    workers = [r["workers"] for r in summary]

    runtime = [r["avg_total_seconds"] for r in summary]

    speedup = [r["speedup"] for r in summary]

    efficiency = [r["efficiency"] for r in summary]

    seconds_mp = [r["seconds_per_megapixel"] for r in summary]

    throughput = [r["throughput_mp_per_sec"] for r in summary]

    ###########################################################################
    # Runtime graph
    ###########################################################################

    plt.figure(figsize=(6,4))

    plt.bar(
        [str(x) for x in workers],
        runtime
    )

    plt.xlabel("Workers")

    plt.ylabel("Average Runtime (s)")

    plt.title(f"{width}x{height}")

    plt.tight_layout()

    plt.savefig(
        OUTPUT_DIR / f"{width}x{height}_runtime.png",
        dpi=200
    )

    plt.close()

    ###########################################################################
    # Speedup
    ###########################################################################

    plt.figure(figsize=(6,4))

    plt.bar(
        [str(x) for x in workers],
        speedup
    )

    plt.xlabel("Workers")

    plt.ylabel("Speedup")

    plt.title(f"{width}x{height}")

    plt.tight_layout()

    plt.savefig(
        OUTPUT_DIR / f"{width}x{height}_speedup.png",
        dpi=200
    )

    plt.close()

    ###########################################################################
    # Efficiency
    ###########################################################################

    plt.figure(figsize=(6,4))

    plt.bar(
        [str(x) for x in workers],
        efficiency
    )

    plt.xlabel("Workers")

    plt.ylabel("Efficiency")

    plt.title(f"{width}x{height}")

    plt.tight_layout()

    plt.savefig(
        OUTPUT_DIR / f"{width}x{height}_efficiency.png",
        dpi=200
    )

    plt.close()

    ###########################################################################
    # Seconds / MP
    ###########################################################################

    plt.figure(figsize=(6,4))

    plt.bar(
        [str(x) for x in workers],
        seconds_mp
    )

    plt.xlabel("Workers")

    plt.ylabel("Seconds / Megapixel")

    plt.title(f"{width}x{height}")

    plt.tight_layout()

    plt.savefig(
        OUTPUT_DIR / f"{width}x{height}_seconds_per_megapixel.png",
        dpi=200
    )

    plt.close()

    ###########################################################################
    # Throughput
    ###########################################################################

    plt.figure(figsize=(6,4))

    plt.bar(
        [str(x) for x in workers],
        throughput
    )

    plt.xlabel("Workers")

    plt.ylabel("Throughput (MP/s)")

    plt.title(f"{width}x{height}")

    plt.tight_layout()

    plt.savefig(
        OUTPUT_DIR / f"{width}x{height}_throughput.png",
        dpi=200
    )

    plt.close()

    ###########################################################################
    # Summary table
    ###########################################################################

    fig, ax = plt.subplots(figsize=(12,3))

    ax.axis("off")

    headers = [
        "Workers",
        "Runtime (s)",
        "Speedup",
        "Efficiency",
        "Sec/MP",
        "Throughput",
        "TP Speedup"
    ]

    table = []

    for r in summary:

        table.append([
            r["workers"],
            f"{r['avg_total_seconds']:.3f}",
            f"{r['speedup']:.3f}",
            f"{r['efficiency']:.3f}",
            f"{r['seconds_per_megapixel']:.3f}",
            f"{r['throughput_mp_per_sec']:.3f}",
            f"{r['throughput_speedup']:.3f}"
        ])

    ax.table(
        cellText=table,
        colLabels=headers,
        loc="center"
    )

    plt.tight_layout()

    plt.savefig(
        OUTPUT_DIR / f"{width}x{height}_table.png",
        dpi=200
    )

    plt.close()


print("===================================================")
print("Analysis complete")
print("Output directory:", OUTPUT_DIR.resolve())
print("===================================================")


cd ~/task-distributor
python3 analyze_results.py
12.2 Reusable chart generation script
cat > ~/task-distributor/analysis/generate_chart.py <<'EOF'
#!/usr/bin/env python3
import matplotlib.pyplot as plt
import pandas as pd

# List of files in the desired left-to-right order
files = [
    "summary_800x600.csv",
    "summary_1600x600.csv",
    "summary_1600x1200.csv",
    "summary_3200x2400.csv",
]

# Set up a 2x4 grid of plots
fig, axes = plt.subplots(nrows=2, ncols=4, figsize=(16, 11), sharex=False)

# Clean, classic style matching the reference image
plt.rcParams["font.family"] = "sans-serif"
plt.rcParams["font.size"] = 11

# ADD THE MAIN HEADING HERE
fig.suptitle(
    "Amdahl's and Gustafson's Law using Task Distributor",
    fontsize=18,
    fontweight="bold",
    y=0.98,
)

for i, file_name in enumerate(files):
    # Load data from the current file
    df = pd.read_csv(file_name)

    # Clean/ensure we use string representations for workers to treat them as discrete categories
    x_labels = df["workers"].astype(str).tolist()
    x_positions = range(len(x_labels))

    # Extract dimensions from filename for a clean plot title
    dimensions = file_name.replace("summary_", "").replace(".csv", "")

    # ----------------------------------------------------
    # UPPER ROW: Average Total Seconds (Dark Grey Bars)
    # ----------------------------------------------------
    ax_top = axes[0, i]
    bars_top = ax_top.bar(
        x_positions,
        df["avg_total_seconds"],
        color="#595959",
        edgecolor="black",
        width=0.9,
    )

    # Formatting top axes
    ax_top.set_title(f"Image Rendering Time\n({dimensions})", pad=15)
    ax_top.set_ylabel("[s]")
    ax_top.set_xticks(x_positions)
    ax_top.set_xticklabels(x_labels)
    ax_top.tick_params(direction="in", top=True, right=True)

    # Set slightly higher y-limit to accommodate the vertical text labels safely
    ax_top.set_ylim(0, max(df["avg_total_seconds"]) * 1.15)

    # Add 2 decimal value annotations vertically inside/above the bars
    for bar in bars_top:
        height = bar.get_height()
        ax_top.text(
            bar.get_x() + bar.get_width() / 2.0,
            height + (max(df["avg_total_seconds"]) * 0.02),
            f"{height:.2f}",
            ha="center",
            va="bottom",
            rotation=90,
        )

    # ----------------------------------------------------
    # LOWER ROW: Speedup (Light Grey Bars)
    # ----------------------------------------------------
    ax_bottom = axes[1, i]
    bars_bottom = ax_bottom.bar(
        x_positions, df["speedup"], color="#b3b3b3", edgecolor="black", width=0.9
    )

    # Formatting bottom axes
    ax_bottom.set_xlabel("Number of Cores (Workers)")
    ax_bottom.set_ylabel("Speedup")
    ax_bottom.set_xticks(x_positions)
    ax_bottom.set_xticklabels(x_labels)
    ax_bottom.tick_params(direction="in", top=True, right=True)

    # Scale dynamically with some headroom for labels
    max_speedup = max(df["speedup"])
    ax_bottom.set_ylim(0, max(max_speedup * 1.2, 2.0))

    # Add 2 decimal speedup annotations vertically above the bars
    for bar in bars_bottom:
        height = bar.get_height()
        ax_bottom.text(
            bar.get_x() + bar.get_width() / 2.0,
            height + (max(df["speedup"]) * 0.02 if max_speedup > 0 else 0.1),
            f"{height:.2f}",
            ha="center",
            va="bottom",
            rotation=90,
        )

# Use rect parameter in tight_layout so the subplots don't collide with the main title
plt.tight_layout(rect=[0, 0, 1, 0.95])

plt.savefig("scalability_plots_td.png", dpi=300)
plt.show()
EOF

cd ~/task-distributor/analysis
python3 generate_chart.py
12.2 Metrics used
| Metric | Formula or definition |
|---|---|
| Runtime | Mean wall-clock runtime over three runs |
| Speedup | S_N = T_1 / T_N |
| Efficiency | E_N = S_N / N |
| Seconds per megapixel | runtime / megapixels |
| Throughput speedup | Megapixels per second relative to the 1-worker case |
13. Results and conclusion
The experiment used a fixed resolution per batch and varied the worker count across 1, 2, 4, and 8 workers.
| Workers | Width | Height | Runs | Average Runtime [s] | Speedup | Efficiency | Serial Fraction Estimate |
|---|---|---|---|---|---|---|---|
| 1 | 800 | 600 | 3 | 4.057 | 1.000 | 1.000 | 0.003 |
| 2 | 800 | 600 | 3 | 4.190 | 0.968 | 0.484 | 0.034 |
| 4 | 800 | 600 | 3 | 6.881 | 0.590 | 0.147 | 0.022 |
| 8 | 800 | 600 | 3 | 9.243 | 0.439 | 0.055 | 0.016 |
| 1 | 1600 | 600 | 3 | 5.057 | 1.000 | 1.000 | 0.002 |
| 2 | 1600 | 600 | 3 | 5.616 | 0.900 | 0.450 | 0.041 |
| 4 | 1600 | 600 | 3 | 6.970 | 0.725 | 0.181 | 0.034 |
| 8 | 1600 | 600 | 3 | 7.989 | 0.633 | 0.079 | 0.029 |
| 1 | 1600 | 1200 | 3 | 7.060 | 1.000 | 1.000 | 0.001 |
| 2 | 1600 | 1200 | 3 | 8.728 | 0.809 | 0.404 | 0.038 |
| 4 | 1600 | 1200 | 3 | 8.832 | 0.799 | 0.200 | 0.049 |
| 8 | 1600 | 1200 | 3 | 11.535 | 0.612 | 0.077 | 0.037 |
| 1 | 3200 | 2400 | 3 | 30.121 | 1.000 | 1.000 | 0.000 |
| 2 | 3200 | 2400 | 3 | 23.806 | 1.265 | 0.633 | 0.044 |
| 4 | 3200 | 2400 | 3 | 18.914 | 1.593 | 0.398 | 0.061 |
| 8 | 3200 | 2400 | 3 | 17.900 | 1.683 | 0.210 | 0.081 |
The results demonstrate a transition from negative to positive parallel scaling dictated by the relationship between workload size and communication overhead. For lower-resolution configurations up to 1600x1200, the fixed task-distribution overhead dominates execution, causing the speedup to drop below 1.000 and efficiency to plunge as core counts increase. Conversely, at the 3200x2400 threshold, the parallel computational workload expands sufficiently to overcome these serialization penalties, achieving a positive speedup of 1.683 on 8 workers in accordance with Gustafson's Law.
13.3 Result charts
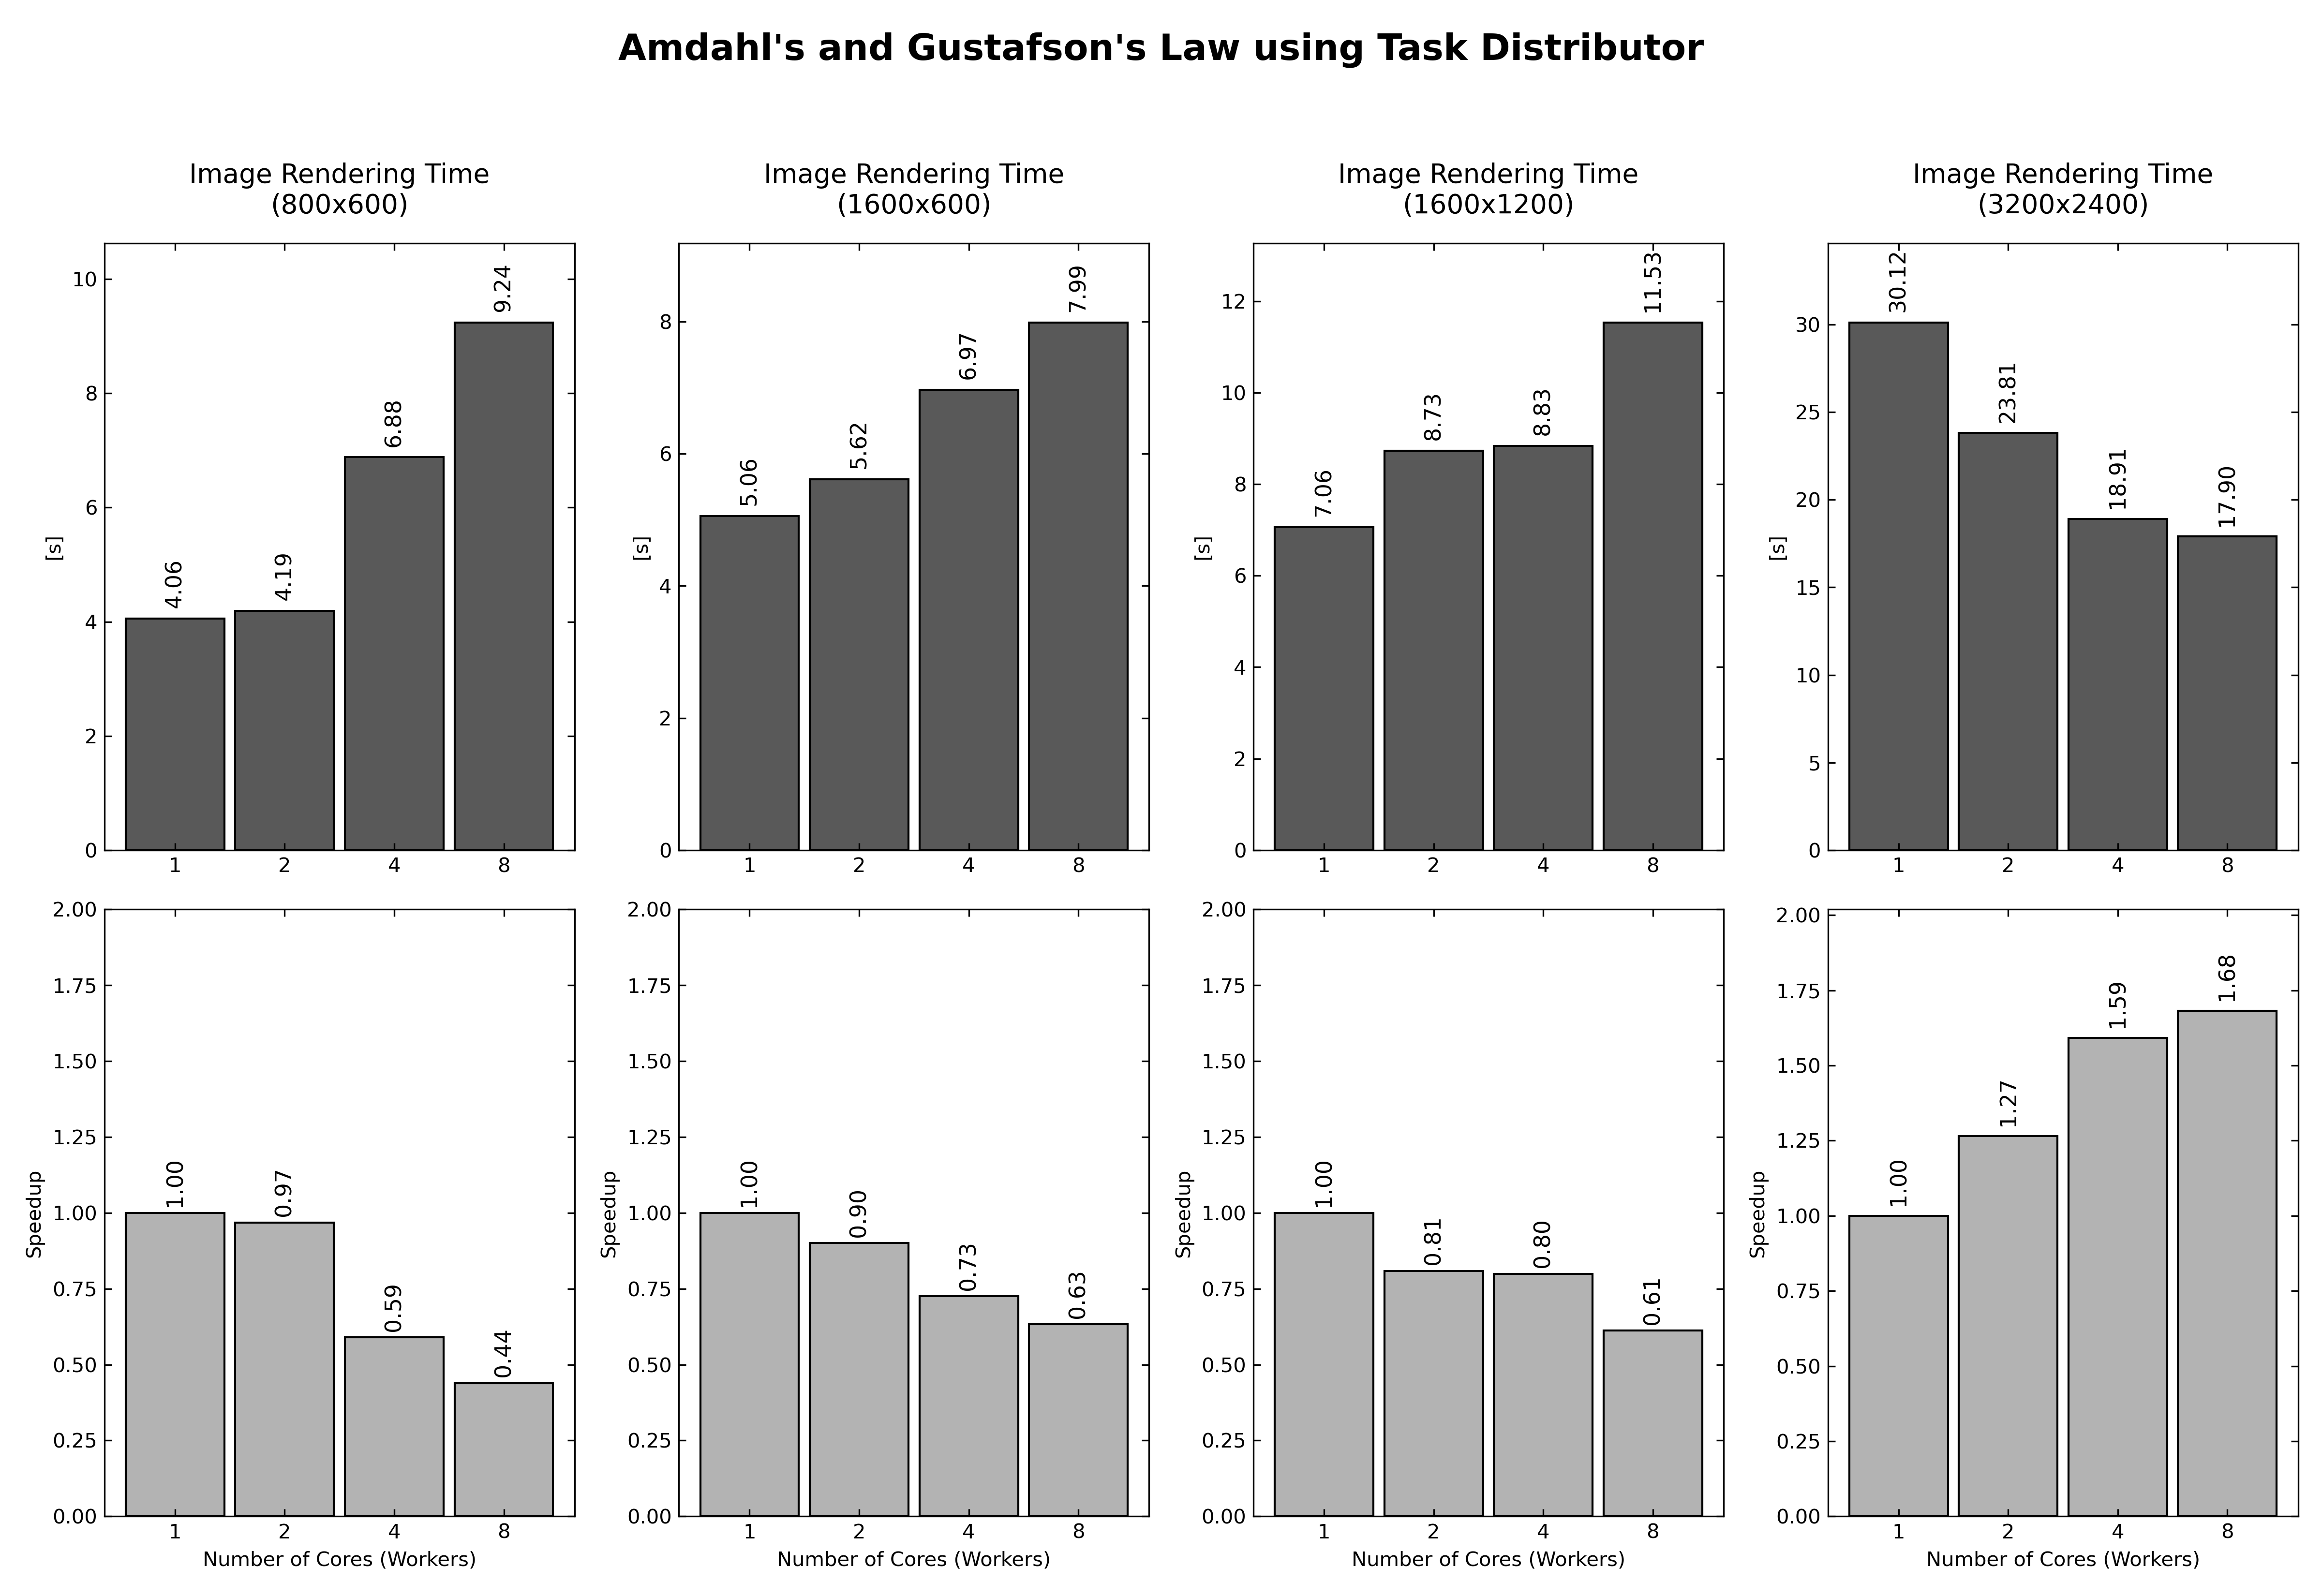
13.4 Final conclusion
This setup demonstrates Amdahl's Law by keeping the workload fixed and showing that adding workers does not guarantee linear speedup. It demonstrates Gustafson's Law by scaling the workload with the number of workers and showing improved throughput for larger workloads. The implementation used a non-MPI tool, Task Distributor, with SSH-based task launch, a shared NFS workspace, POV-Ray rendering, ImageMagick image composition, and a shared PXE/NFS root filesystem for the Pi 3 workers.